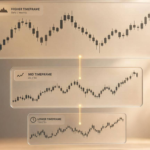
Multi-Timeframe Trend Analysis (MTFA) is a trading method that helps you make better decisions by analysing an asset across three timeframes: higher, medium, and lower. Here’s why it matters:
- Higher Timeframe: Shows the overall market trend and key levels (e.g., support, resistance).
- Medium Timeframe: Highlights market structure like pullbacks and consolidation zones.
- Lower Timeframe: Pinpoints precise entry and exit points.
By aligning these timeframes, you can avoid trading against the dominant trend, reduce false signals, and improve your trade timing. For instance, a bullish signal on a 15-minute chart might be misleading if the daily trend is bearish. MTFA ensures you see the bigger picture and act accordingly.
Key Takeaways:
- Start with the higher timeframe to confirm the main trend.
- Use the medium timeframe to find setups and patterns.
- Refine entries and exits on the lower timeframe.
This structured approach reduces mistakes like entering trades at weak levels or setting stops too close to market noise. Stick to a consistent timeframe combination (e.g., Daily, 4-Hour, 1-Hour) that suits your trading style, whether you’re scalping, day trading, or swing trading.
What is Multi-Timeframe Trend Analysis?
Definition and Purpose
Multi-Timeframe Trend Analysis (MTFA) is all about examining an asset’s movement across three different timeframes to get a clearer picture of its market structure. Traders typically analyse higher, middle, and lower timeframes, with each one serving a specific role.
This approach leverages the market’s fractal nature, where trends, pullbacks, and consolidations happen simultaneously across various timeframes. For example, a strong uptrend on a 15-minute chart might actually be just a minor pullback within a larger downtrend visible on the daily chart. By using MTFA, traders avoid making decisions based solely on a single timeframe, which could lead to entering trades at unfavourable points, such as near major resistance or support levels.
Professional traders often rely on a three-timeframe “stack” (e.g., Daily, 4-Hour, and 1-Hour charts). Each timeframe has a role: the highest sets the overall trend or bias, the middle gives insight into the market structure, and the lowest helps pinpoint entry and exit points. The key objective is to identify confluence – when multiple timeframes align in both direction and timing. This alignment can significantly improve the odds of a successful trade, with MTFA often filtering out up to 80% of false trading signals.
Understanding how these timeframes interact is essential for piecing together the full market picture.
How Trends Align Across Different Timeframes
Each timeframe in MTFA provides a unique perspective, and together, they create a cohesive strategy for understanding and trading the market.
The higher timeframe serves as a trend filter, offering a “satellite view” of the market. It reveals the dominant trend through patterns like higher highs and higher lows, while also highlighting major support and resistance levels. Think of it as your guide to whether the market is generally moving uphill or downhill.
The medium timeframe dives deeper into market structure. It shows consolidation zones, breakout levels, and intermediate support or resistance areas. At this level, you can determine where the price is within the larger trend – whether it’s nearing the top of a rally or sitting at the bottom of a pullback.
“The 4h chart is the satellite view – it shows you the terrain… The 5m chart is the real-time navigation telling you exactly when to turn. You need all of them to reach your destination safely.” – TrendRider
The lower timeframe is where precision comes into play. It helps traders time their entries during pullbacks or momentum shifts while enabling tight stop-loss placements to optimise risk-reward ratios. By aligning all three timeframes, traders can make more informed decisions, optimising their chances of capturing market momentum effectively.
sbb-itb-466c9b0
Why Multi-Timeframe Analysis Matters
Building on the discussion of aligning trends across timeframes, let’s explore why incorporating multiple timeframes can sharpen your trading decisions.
Stronger Trend Confirmation
Looking at just one timeframe is like peeking through a keyhole – you’re missing the bigger picture. Multi-timeframe analysis (MTFA) widens your perspective, revealing how trends, pullbacks, and consolidations interact across different time horizons. For instance, a breakout on a 15-minute chart might seem promising but could merely be a minor fluctuation within a larger downtrend visible on the daily chart.
By aligning trends across higher, middle, and lower timeframes, you can confirm the true market direction instead of reacting to short-term noise. When all timeframes point in the same direction, you’re trading with the dominant trend, reducing the likelihood of falling for false signals or breakouts. This alignment significantly boosts the quality of your trades and increases your chances of success.
More Accurate Entry and Exit Timing
MTFA offers a key advantage: precise timing. Higher timeframes help you establish your directional bias, while lower timeframes refine your entry and exit points. This allows you to set tighter stop-losses based on the lower timeframe’s volatility while targeting profits defined by the structure of the higher timeframe.
For example, a trade in BBWI identified a long-term uptrend on the weekly chart, confirmed by daily and 4-hour charts, resulting in a 27% rally with an additional 5% gain.
Lower timeframes also highlight momentum shifts and pattern completions, ensuring your trades align with the prevailing market flow. This approach shortens holding periods and limits exposure to unnecessary volatility.
Clearer Market Structure Context
One of the most valuable aspects of MTFA is understanding your position within the broader market structure. The middle timeframe helps identify key elements such as swing highs and lows, channels, and supply-demand zones. This prevents costly mistakes like buying into strong resistance or selling into significant support – errors that are easier to make when focusing on a single chart.
“One chart conveys a story; several charts reveal the context, the subtext, and the timing.” – Singapore Forex Club
This broader awareness also helps you anticipate liquidity sweeps before the market resumes its primary trend. A top-down approach ensures you avoid getting caught in short-term fakeouts. It’s worth noting that approximately 81.4% of retail CFD accounts lose money, often due to trading against the dominant trend or entering at structurally weak levels. MTFA helps keep you aligned with the market’s flow.
With these benefits in mind, the next section will guide you on selecting the best timeframes for your trading strategy.
Choosing the Right Timeframes
When using multi-timeframe analysis (MTFA), it’s essential to pick timeframes that align with your trading style and the duration you plan to hold your trades.
The 1:4 Ratio Method
A common and effective approach is the 1:4 ratio method. This method suggests that each timeframe in your analysis should be roughly four to six times larger or smaller than the next. For example, if your entry chart is 1‑hour, the middle timeframe could be a 4‑hour chart, and the trend timeframe might follow a 1:4:16 pattern – like a daily or 16‑hour chart.
Why is this spacing important? If your timeframes are too close, you’ll end up with overlapping or redundant data. Properly spaced charts let you use the higher timeframe to filter out market noise, the middle timeframe to identify setups, and the lower timeframe to fine-tune your entry.
Many seasoned traders stick to a three-timeframe approach: one for identifying the trend, one for analysing market structure, and one for execution. Using more than three can lead to over-analysis and conflicting signals, while relying on just one may cause you to miss the broader trend.
This structured method allows you to customise timeframe combinations for your specific trading needs.
Timeframe Combinations by Trading Style
Here’s how the three-timeframe stack can be applied to different trading styles:
| Trading Style | Higher Frame (Trend) | Middle Frame (Setup) | Lower Frame (Entry) |
|---|---|---|---|
| Position Trading | Monthly | Weekly | Daily or 4‑Hour |
| Swing Trading | Weekly or Daily | Daily or 4‑Hour | 4‑Hour or 1‑Hour |
| Day Trading | Daily or 4‑Hour | 1‑Hour or 15‑Minute | 5‑Minute or 1‑Minute |
| Scalping | 1‑Hour or 15‑Minute | 5‑Minute | 1‑Minute or Tick Chart |
For example, a swing trader might start with the weekly chart to confirm the trend, then move to the daily chart to find key support and resistance levels, and finally use the 4‑hour or 1‑hour chart to pinpoint the best entry point. On the other hand, a day trader could use the daily chart for overall direction, the 1‑hour chart for market structure, and the 15‑minute chart for entry timing.
Once you’ve chosen a timeframe combination, stick with it for at least 30–50 trades. This consistency will help you develop a deeper understanding of how the timeframes interact and build confidence in your strategy.
Master Systematic Trading with Collin Seow
Learn proven trading strategies, improve your market timing, and achieve financial success with our expert-led courses and resources.
How to Perform Multi-Timeframe Trend Analysis
To effectively use Multi-Timeframe Analysis (MTFA), start with a top-down approach. This means beginning with the broader market perspective and gradually narrowing down to the finer details for execution. This method helps you avoid making decisions based on the noise of lower timeframes while ignoring the primary trend.
Step 1: Check the Main Trend on Higher Timeframes
Start by examining the overall market direction on the highest timeframe that suits your trading style. For swing traders, this might be the weekly or daily chart, while day traders might focus on the daily or 4-hour chart. The objective here is to determine whether the market is trending upward (higher highs and higher lows), trending downward (lower highs and lower lows), or moving sideways.
Mark key horizontal support and resistance levels and observe how prices interact with long-term moving averages like the 50-period or 200-period SMA. These levels are far more influential than those on smaller timeframes, such as the 15-minute chart.
“Higher timeframe support and resistance levels carry more importance which is why you should always look for your levels on your higher timeframe.” – Rolf from Tradeciety
At this stage, focus on defining your directional bias. Avoid trading against the higher timeframe trend, as it can reduce the likelihood of success. Once you have a clear understanding of the overall market trend, move on to the intermediate timeframe to identify potential trade setups.
Step 2: Review Intermediate Trends on Medium Timeframes
The next step is to analyse the medium timeframe for specific trade setups. Here, you’ll look for pullbacks, consolidations, or patterns like flags and triangles that align with the trend identified on the higher timeframe.
Use technical indicators such as the 20- or 50-period EMA, MACD, or RSI to spot momentum shifts. For instance, if the higher timeframe shows a bullish trend and the medium timeframe reveals a pullback to a critical support level accompanied by bullish MACD divergence, you’ve found a potential high-probability setup.
An example of this approach can be seen with traders analysing Bath and Body Works (BBWI) between November 2023 and May 2024. They first identified a long-term trend shift using a 12-week SMA positive crossover. Then, they moved to the daily chart, where a 10-day SMA crossover and a breakout above a resistance trendline in early December signalled a setup. This alignment ultimately led to a 27% rally.
If the medium timeframe contradicts the higher timeframe trend, it’s better to wait for alignment before entering a trade. Once the setup is confirmed, proceed to the lower timeframe to refine your entry.
Step 3: Find Entry Points on Lower Timeframes
After confirming the setup on the medium timeframe, use the lower timeframe to fine-tune your entry.
Look for common candlestick patterns, such as engulfing candles or break-and-retest formations, that indicate a continuation of the larger trend. For example, in a bullish swing trade, you might wait for a bullish engulfing pattern on the 1-hour chart at a key support level.
“The lower frame is almost always for entry and immediate trade management.” – Singapore Forex Club
When setting your stop-loss, base it on the structure of the lower timeframe. For long trades, this typically means placing it just below a micro-swing low. However, ensure it’s not positioned where the medium timeframe might trigger a liquidity sweep during a reversal.
Tools and Indicators for Multi-Timeframe Analysis
Using the right tools is crucial for validating trends and spotting reliable setups across various timeframes. By combining different indicators, traders can filter out false signals and improve decision-making. Here’s how some of the most effective tools can be integrated into a multi-timeframe strategy.
Moving Averages and Trendlines
Moving averages are excellent for identifying trends and refining entry points across timeframes. For instance, the 200-period Simple Moving Average (SMA) on daily or weekly charts serves as a guideline for the overall market direction. Meanwhile, the 50-period SMA on medium timeframes, such as the 4-hour chart, helps identify pullback zones that align with the higher timeframe trend.
Trendlines from higher timeframes can also provide a clear directional bias. For example, a trendline connecting swing lows on a weekly chart can help pinpoint where the trend might resume on a daily chart after a pullback. On shorter timeframes, breaking micro-trendlines often signals the end of a counter-trend move and the continuation of the main trend.
“The higher timeframe always takes precedence. Never trade against the higher timeframe trend based on a lower timeframe signal.” – Finwiz.io
Momentum indicators are the next step in validating trend dynamics.
Momentum and Divergence Indicators
Momentum indicators like RSI and MACD confirm shifts in momentum and the strength of trends across timeframes. For instance, if the RSI shows oversold conditions on both the daily and 4-hour charts, the bullish signal is much stronger than if it appeared on just one timeframe. In an uptrend, RSI pullbacks to the 40–50 range on medium or lower timeframes often signal potential buying opportunities, even if the indicator doesn’t drop below 30.
MACD crossovers on medium timeframes can also confirm that a pullback has ended and the main trend is resuming. Traders often look for alignment between timeframes – for example, a bullish MACD crossover on the 4-hour chart, supported by a similar signal on the 1-hour chart, creates a stronger entry signal.
Bollinger Bands are another valuable tool, helping to identify volatility and dynamic support or resistance levels. A narrowing of Bollinger Bands on lower timeframes often signals an impending breakout in the direction of the higher timeframe trend. Divergences, such as price hitting new highs without a corresponding increase in RSI, can also indicate potential reversals. These divergences are most effective when monitored across at least two timeframes.
Fibonacci Retracements Across Timeframes
Fibonacci retracements are a great complement to moving averages and trendlines, as they highlight key levels where reversals or continuations may occur. Start by applying key Fibonacci levels (38.2%, 50%, 61.8%) to the primary trend on a daily chart to identify major pullback zones. Then, switch to the 4-hour chart to check if these levels align with intermediate trendlines or moving averages.
When multiple levels overlap, such as a daily 200-MA aligning with a 1-hour 61.8% Fibonacci retracement, a confluence zone is created. These zones are strong candidates for reversals or continuation setups. Once price reaches a major Fibonacci level, drop to lower timeframes like the 1-hour or 15-minute chart to look for candlestick patterns or momentum shifts that confirm the trade.
However, avoid trading solely based on Fibonacci levels from lower timeframes if they contradict the higher timeframe trend. By anchoring your Fibonacci analysis on a middle timeframe and seeking confirmation on shorter timeframes, you can ensure your trades align with the primary trend.
Conclusion
A multi-timeframe trend analysis simplifies and structures your trading process. By assigning each timeframe a specific role – using the higher timeframe for overall market bias, the middle for structural insights, and the lower for pinpointing entries – you gain a clearer and more detailed understanding of market conditions. This method helps cut through market noise, reduces false signals, and keeps you aligned with the prevailing trend.
The benefits of this approach lie in its ability to guide disciplined execution. The secret to success is sticking to a consistent trading strategy. Choose a combination of timeframes that suits your trading style and commit to it. This consistency allows you to refine your approach over time without second-guessing your decisions. Remember, successful traders don’t act on every signal – they wait for all three timeframes to align before taking action.
Start by analysing the higher timeframe to determine the market’s directional bias. Then, use the middle timeframe to identify key levels and structural patterns. Finally, focus on the lower timeframe to fine-tune your entry points. A pre-trade checklist can help ensure alignment across these timeframes, while documenting setups with screenshots from each timeframe allows for ongoing improvement.
The goal of multi-timeframe analysis isn’t to increase the number of trades – it’s to improve their quality. By applying this method consistently, you’ll find trades with better context and higher chances of success. Over time, this approach will enhance your decision-making and elevate your trading outcomes, giving you a deeper understanding of market dynamics and a more effective strategy.
FAQs
What should I do when timeframes conflict?
When you’re dealing with conflicting timeframes, it’s best to prioritise the higher timeframe. This gives you a clearer picture of the overall trend and market context. Lower timeframes, on the other hand, are more useful for pinpointing precise entry points and managing your trades effectively. By aligning your decisions with the broader market direction, you can maintain greater consistency in your trading approach.
Which 3 timeframes suit my trading style best?
The ideal timeframes for trading largely depend on your strategy and objectives. Many traders rely on a higher timeframe, like the daily chart, to spot overall trends, while using a lower timeframe, such as the 1-hour chart, to fine-tune their entry points. For those focusing on longer-term trades, daily and 4-hour charts tend to be effective. On the other hand, short-term traders or scalpers often gravitate towards 15-minute or 5-minute charts for quicker decisions. Ultimately, the key is to pick timeframes that match your risk appetite and how frequently you plan to trade.
How do I spot strong confluence before entering?
To spot strong alignment before making a trade, begin by analysing higher timeframes like daily or weekly charts. These give you a clear picture of the overall trend and critical levels. Once you confirm the broader trend, make sure your trading timeframe aligns with it. Finally, look at lower timeframes to fine-tune your entry points and set risk levels. This method helps filter out false signals and increases the likelihood of successful trades.