
About the Security (NASDAQ: AAXJ)
iShares MSCI All Country Asia ex-Japan ETF seeks to track the investment results of an index composed of Asian equities, excluding Japan.
The ETF’s exposure comprises large to mid-sized companies in emerging and developed Asian economies (excluding Japan). China accounts for more than a third of AAXJ, followed by Taiwan, India, and South Korea.
Security background:
Asian equities are at record highs thanks to attractive valuations, a decent economic growth outlook, and the weakening US dollar.
In June 2025, this column had highlighted the potential for a resumption of an uptrend in Asian equities (“Asian Equities: Finally Out of the Woods?” dated 25 June 2025). The ETF is up around 25% since, and is showing no sign of reversal yet.
Policy Support and AI Demand in Asia
Despite trade/tariff-related uncertainties, the regional growth has held up well due to policy support and strong AI demand.
The impressive rebound in Asian equities has been associated with a re-rating of regional equities. As a result, valuations are no longer as cheap as last year, but still attractive compared to their US counterpart.
Moreover, the weaker US dollar outlook on concerns regarding the mounting US debt is a potential catalyst for diversification of investor portfolios into other asset classes and geography. In this regard, the rally in precious metals is partly a reflection of the diversification theme.
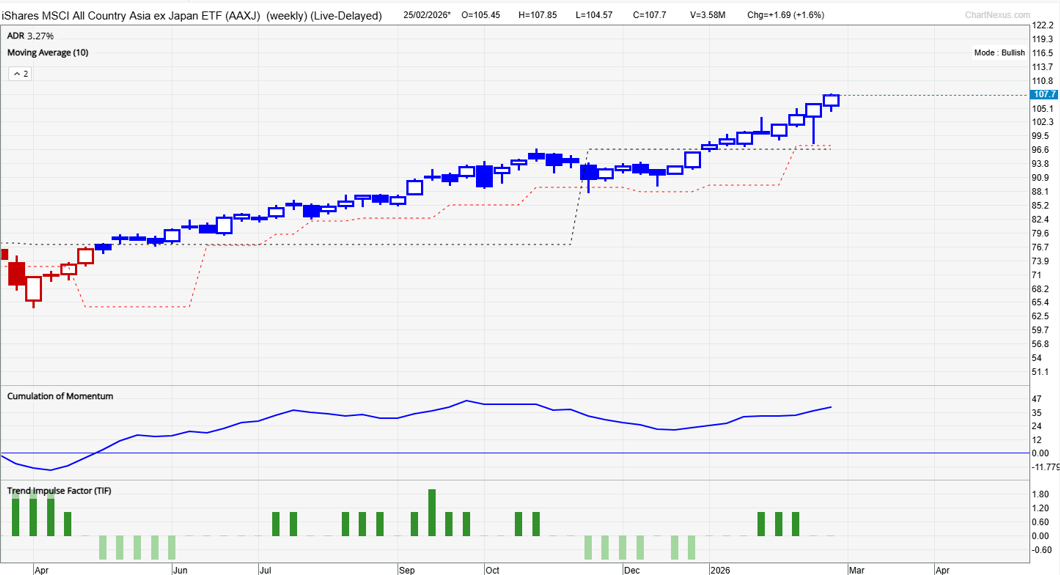
AAXJ (Weekly):
Technical Analysis on MSCI All Country Asia ex-Japan (NASDAQ: AAXJ)
Our proprietary system, TradersGPS (TGPS), turned decisively Bullish in May 2025 after the security broke above vital resistance at 77.50.
As per our system, Blue candles indicate the stock’s trend is up. Red candles indicate the trend is down. Since then, the candle colour has remained Blue – a vital feature for passive, long-term investors.
Typically, signals on Weekly charts have a multi-month implication, as the chart shows, allowing investors to participate in a trend. Frequent changes in trend assessments can be less profitable and, at times, frustrating.
AAXJ (Monthly):
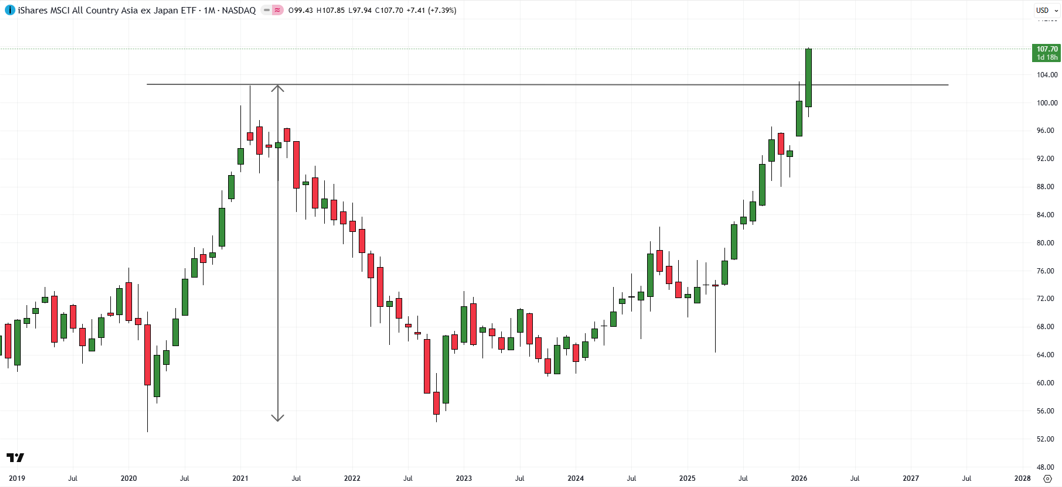
Major Resistance
On the weekly candlestick charts, AAXJ has recouped the entire loss from 2021. The ETF is attempting to break above major resistance at the 2021 high of 102.45.
This now leaves the ETF in uncharted territory. However, technical patterns can give a sense of the potential trend and the extent of the uptrend.
A decisive break above 102.45 (two monthly closes) would trigger a major double bottom (the 2020 and 2022 lows), pointing to a potential rise toward 150 in the coming years.
To be sure, the target is indicative rather than definitive, and can be characterised by frequent swings. Still, technical patterns are helpful in providing a sense of the trend.
On the downside, there is quite strong support at the early-February low of 98.50, followed by support on the 100-day moving average (now at about 98.00).
FAQ
What is the AAXJ ETF?
The iShares MSCI All Country Asia ex-Japan ETF tracks a basket of Asian equities excluding Japan, covering major markets such as China, Taiwan, India, and South Korea.
Why are Asian equities rallying?
Improving economic growth, attractive valuations compared with US equities, and a weaker US dollar have supported the rally.
What resistance level is the ETF testing now?
The ETF is attempting to break above the 2021 high of 102.45, which would place the market in uncharted territory.
Where are the key support levels?
Important support lies near 98.50 and around the 100-day moving average near 98.