
About the Stock (NASDAQ: MSFT)
Microsoft Corporation is an American multinational technology conglomerate headquartered in Washington.
From the initial days of providing computer operating software like Windows, the company has expanded to internet services, cloud computing, artificial intelligence, gaming, and other businesses, including collaborations with governments and enterprises.
Stock background:
Microsoft shares saw their biggest daily decline since 2000 despite the fact that the company announced second-quarter earnings that beat market expectations. The perception that the cloud computing business grew more slowly than expected possibly led to the decline.
The earnings could have been a catalyst for a correction, which was brewing even before the announcement of the results. Our proprietary TradersGPS (TGPS) system was able to pick the change in trend well in advance (see below).
AI Investment and Valuation Concerns
Concerns regarding stretched investment in AI infrastructure, slowing growth in a major revenue-generating segment, extreme overbought conditions, and a rapid 60% jump since April 2025 call for a pause in the rally at the very least.
The key question remains: Is it time to look at the stock constructively?
From a long-term fundamental perspective, there is very little doubt in the bullish structural story. Being an early leader in AI is transforming the company into a key global infrastructure player for governments and corporations.
However, from a price perspective, we may not be there.
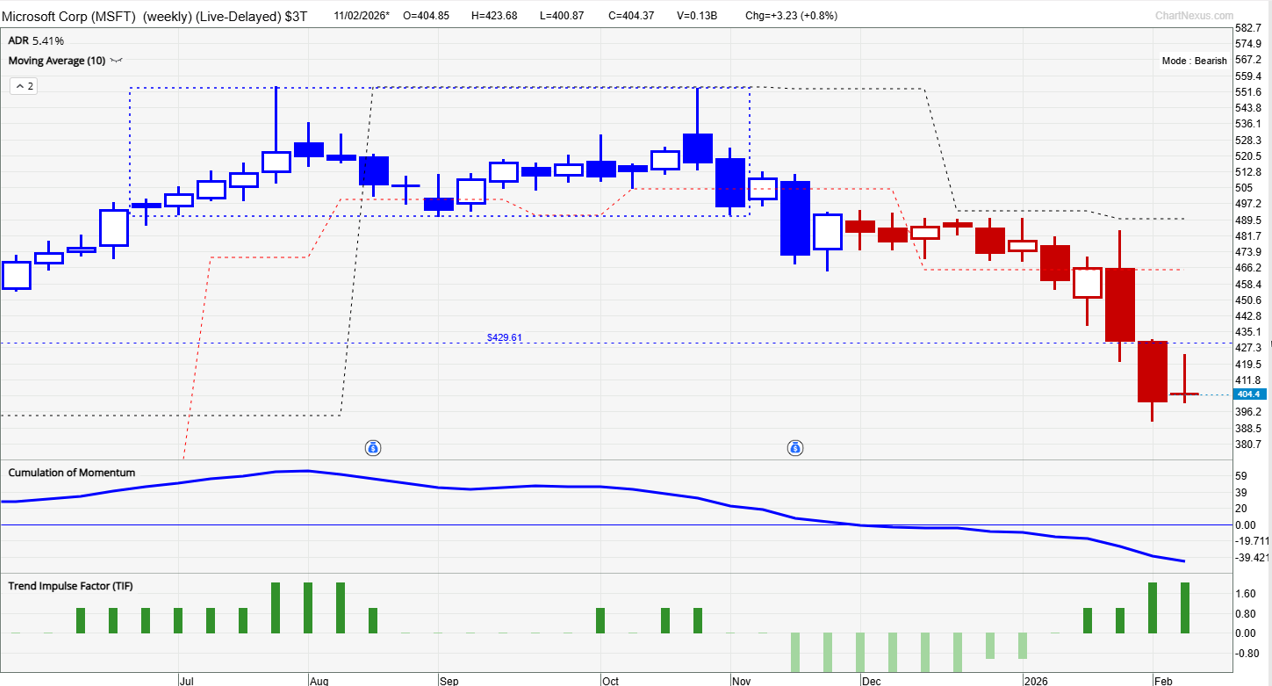
MSFT (Weekly):
Technical Analysis on Nucor Corporation (NASDAQ: MSFT)
Our TradersGPS (TGPS) system was able to pick the downtrend before it actually unfolded. Blue candles indicate the stock’s trend is up. Red candles indicate the trend is down.
On the weekly chart, the system was bullish until the end of last year when the candle colour changed to red. Since December, the candle colour has remained red, a reflection of the downtrend.
On the daily chart, the candle colour continues to remain Red, suggesting the stock’s downtrend hasn’t terminated just yet.
MSFT (Daily):
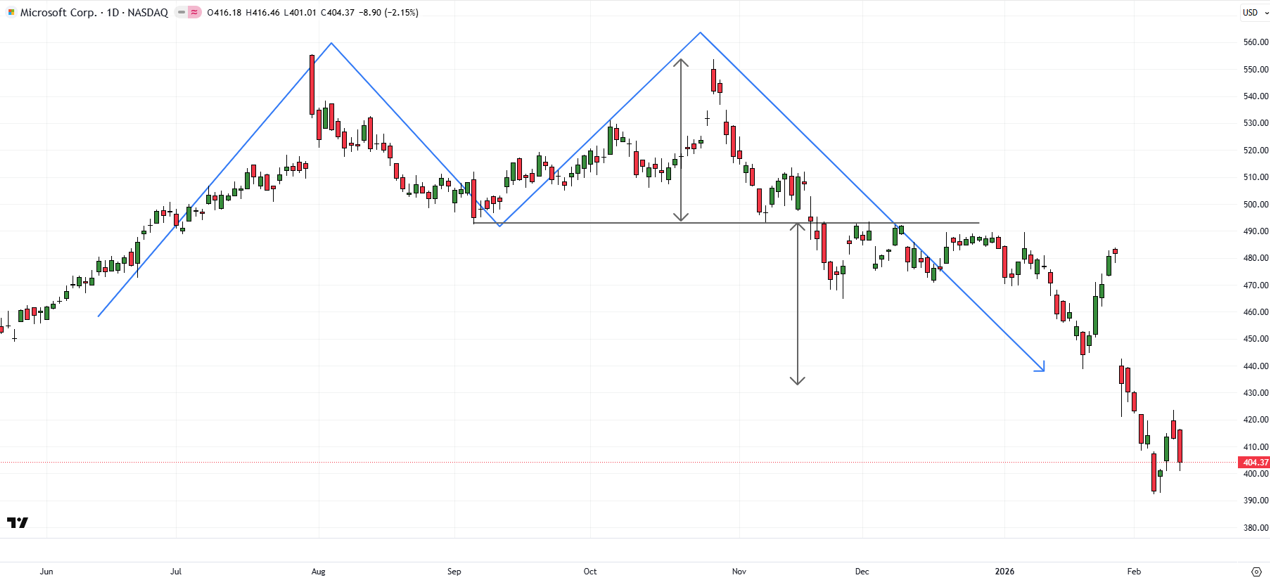
Microsoft shares’ drop below key support at the September 2025 low of 492 triggered a major double top pattern (the 2025 highs), pointing to a fall toward 430.
However, as with all technical patterns, the price objective of the pattern can sometimes be the minimum extent of the move. As the stock shows, the current price is well below the price objective of the bearish pattern.
MSFT (Weekly):
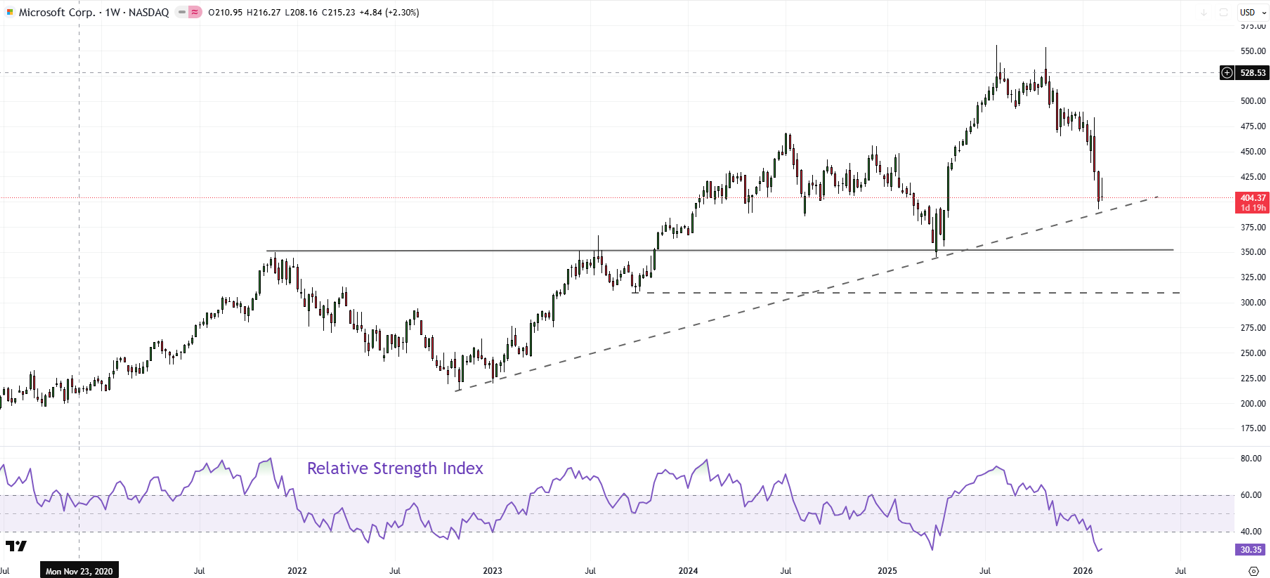
Oversold Conditions
The stock is not approaching support on an uptrend line from 2022 (now at about 390). Given deeply oversold conditions – the 14-week Relative Strength Index is at the lowest level in years – a minor rebound/consolidation is possible.
Would I be willing to participate in that rebound?
Probably not. I’d rather wait for our system to turn bullish, that is, the candle colour to turn Blue. Granted, a later entry can mean an expensive entry, but a less-risky entry (currently, we don’t know if the stock has bottomed – it could have more downside, that is, more risk).
Key Support Levels
Below 390, there is stronger support on a horizontal trendline from 2021 (now at about 350), which could provide a good cushion.
FAQ
Why did Microsoft stock fall despite an earnings beat?
Concerns about slowing cloud growth, stretched AI infrastructure spending, and extreme overbought conditions triggered selling pressure.
What does TradersGPS indicate for MSFT?
The weekly and daily TradersGPS signals have remained Bearish since December, reflecting an ongoing downtrend.
What technical pattern was triggered?
A double top pattern was activated after the price broke below the September 2025 low of 492, pointing toward 430.
Is Microsoft oversold?
The 14-week RSI is at multi-year lows, suggesting oversold conditions and the possibility of a short-term rebound.