Momentum trading can be a powerful strategy, but it’s easy to make costly mistakes. Here are the 10 most common mistakes traders face in momentum analysis and how to avoid them:
1. Mistaking Momentum for Reversal Signals
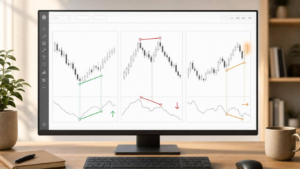
One common error traders make is confusing strong momentum with signs of a price reversal. This often happens when traders rely heavily on oscillators like the Relative Strength Index (RSI) or the Stochastic Oscillator to identify “overbought” or “oversold” conditions. For example, when RSI exceeds 70% or the Stochastic Oscillator surpasses 80%, many assume a reversal is imminent. However, these extreme readings typically indicate a continuation of the trend, not its exhaustion [3, 11].
Momentum often signals strength rather than weakness. Assets can remain overbought or oversold for extended periods. Take Meta (formerly Facebook) stock between July and November 2021 as an example [3, 11]. On 20 September 2021, the Stochastic Oscillator dropped below 20%, signalling an “oversold” condition. Traders who entered long positions expecting a rebound were caught off guard when the price continued to decline through mid-October, despite the oscillator staying in extreme territory.
This misstep often stems from the “mean-reversion trap” – the mistaken belief that prices will naturally return to a historical average. Betting against a strong trend can put traders in a precarious position, especially when relying on lagging indicators for confirmation. By the time these indicators signal a reversal, the price may have already moved significantly, leading to poorly timed trades.
To avoid this, combine oscillators with trend-following tools like Moving Averages (MAs). For instance, if the 20-day and 40-day MAs are still trending upwards, a price dip is more likely a pullback than a reversal. Also, watch for volume spikes during breakouts – strong momentum is usually accompanied by high market participation [6, 7]. As Collin Seow wisely advises, “The trend is your friend.”
2. Ignoring Market Context
Analysing momentum without considering the market context is like setting sail in Singapore without checking the tide – you’re at the mercy of broader forces that shape your journey. Momentum indicators don’t function in isolation; they rely on the backdrop of overall market conditions, macroeconomic trends, and sector-specific movements to generate accurate signals.
This becomes especially clear when market conditions shift. Momentum strategies thrive in trending markets but often stumble in sideways or range-bound scenarios. Take the Straits Times Index, for instance: when it moves sideways without a clear direction, momentum setups are more likely to generate false signals or result in whipsaws. A challenging market environment can erode even the strongest stock’s momentum.
Macroeconomic factors play a big role in driving momentum. Elements like interest rate cycles, inflation data, GDP growth, and policy announcements from the Monetary Authority of Singapore (MAS) can all impact whether a stock can sustain its momentum. For example, a banking stock might show strong short-term momentum, but if MAS hints at rising interest rates, the risk profile of that trade shifts dramatically. Similarly, earnings reports or geopolitical events can cause sudden reversals that no technical indicator can foresee.
To navigate these complexities, consider a dual-timeframe strategy. Analyse the market’s overall direction using weekly or monthly charts, and then refine your entry points with daily or hourly charts. Before committing to a momentum trade, review the economic calendar for high-impact events, confirm volume activity, and ensure a clear trend is in place. These steps help align momentum strategies with the realities of the current market.
Understanding the context isn’t just useful – it’s what separates riding a true momentum wave from getting caught in the noise.
3. Using Momentum Indicators Alone
Depending only on momentum indicators to trade in Singapore’s financial markets is like navigating with one eye shut – you’re ignoring key details that could influence your decisions. While these indicators measure the pace of price changes, they don’t provide insights into overall market direction, trading volume, or external factors that might affect the market. As mentioned earlier, momentum indicators work best when combined with other tools to give a more complete view.
One common issue is that indicators can stay in extreme zones during strong trends. For example, the RSI might remain above 70, or the Stochastic Oscillator could stay above 80 for a long stretch, even as prices keep climbing. This kind of divergence can occur unexpectedly, and when different momentum tools send conflicting signals, it can make decision-making even trickier. Later, we’ll explore how these extreme readings can lead traders astray.
To address these limitations, it’s essential to consider volume and the broader market context when interpreting momentum signals. A price move without strong volume backing it up can be risky. Momentum indicators don’t factor in trading volume, which is key to assessing whether a price movement is genuinely supported by market participants. For instance, an RSI breakout might be less trustworthy if it happens during low trading volume, as it could indicate a false breakout that might reverse soon after.
To improve reliability, combine momentum oscillators with trend indicators like Moving Averages and always check volume during potential breakouts. Additionally, keep an eye on the economic calendar to steer clear of surprises, such as earnings reports or announcements from the Monetary Authority of Singapore (MAS).
4. Overlooking Risk Management
Getting momentum analysis right is crucial, but it’s only part of the equation. Equally important – if not more so – is having a strong risk management plan to protect your trades from potential pitfalls.
Momentum trading can deliver quick profits, but it’s a high-stakes game. Without proper safeguards, a single misstep could drain your account. As FinMentorHub aptly states:
“Momentum trading without strict risk control is like driving a sports car without brakes. High potential rewards come with equally high risks.”
One key tool in your risk management arsenal is the stop-loss order. This automatically closes your position once the price hits a pre-set level, capping your losses. For momentum trading, trailing stop-losses are especially effective. They allow your profits to grow as the price moves in your favour, while still offering protection if the trend reverses.
Experienced traders often stick to a rule of risking only 1% to 2% of their total capital on a single trade. For instance, if you have a S$50,000 account and risk 1–2% per trade, you’re looking at a maximum risk of S$500–S$1,000. Say you enter a trade at S$10.00 with a stop-loss at S$9.50, risking S$0.50 per share. With a S$500 risk, you could buy up to 1,000 shares. You can also use tools like the Average True Range (ATR) to size your positions based on market volatility, which is particularly useful in turbulent conditions.
Failing to implement these strategies can lead to catastrophic outcomes. Take the infamous case of Barings Bank, which collapsed after trader Nick Leeson’s unauthorised and risky bets resulted in losses of £800 million. Clear stop-loss levels could have significantly reduced those losses. In fact, around 90% of traders lose money – not necessarily because their strategies are flawed, but because they lack the discipline to manage risk effectively.
Another critical principle is maintaining a risk-reward ratio of at least 1:2. For example, if you’re risking S$500, aim for a potential profit of at least S$1,000. As Claire Williamson from IG SG explains:
“This approach means you can be right only half the time and still maintain profitability.”
Finally, setting clear exit criteria is essential to keep emotions in check and avoid impulsive decisions that could derail your trades.
5. Entering Trades Too Late
Getting into a trade after a big price surge can drastically shrink your profit potential and ramp up your risk. Why? Late entries often mean you’re buying at the peak, just as the early traders are cashing out. This leaves you vulnerable to sudden reversals. Early entries, on the other hand, tend to offer better rewards with lower risks, while jumping in late exposes you to unpredictable price swings and sharp pullbacks.
A common sign of a late entry is when technical indicators hit extreme levels. For instance, if the RSI goes above 70 or the Stochastic Oscillator climbs past 80, it often suggests that the momentum is fading. Another red flag is bearish divergence – when the price hits a new high, but the momentum indicator doesn’t follow suit, forming a lower high instead. Similarly, rapid price increases on declining volume signal that the upward push is losing steam.
To avoid the trap of late entries, make sure to confirm breakouts with a noticeable spike in volume before entering a trade. Strong momentum usually comes with high trading activity – look for securities with daily trading volumes exceeding 5 million shares. Use a top-down approach: start by analysing daily or weekly charts to confirm the broader trend, then zoom into hourly charts to find precise entry points that align with the overall direction. This method ensures you’re trading in sync with the main trend.
Timing is everything. Just like managing risk protects your portfolio, disciplined entry timing can help you make the most of market trends. Resist the urge to chase trades just because they’re making headlines or showing impressive short-term gains. Instead, stick to your predefined entry rules based on reliable technical signals.
sbb-itb-466c9b0
6. Relying Too Much on Technical Indicators
Loading up on too many technical indicators can leave you stuck in analysis paralysis – a situation where conflicting signals make it harder to act decisively. Picture this: your RSI indicates “overbought”, your MACD flashes “buy”, and your Stochastic Oscillator sits somewhere in the middle. Which one should you trust? This kind of mixed messaging can delay your decisions, causing you to miss out on key opportunities. It highlights the importance of being selective when using technical analysis tools.
Another drawback? Technical indicators often lag behind market events. By the time indicators like moving averages or MACD confirm a trend, the ideal entry point may already be gone. And if you’re relying solely on charts, you might overlook critical fundamental factors – such as breaking news or economic data – that can disrupt your technical setup in an instant.
“Technical indicators are useful tools, but relying on them too heavily can cloud judgment. It’s crucial to… understand that they serve as aids to decision-making, not decision-makers in themselves.” – Mr. Soumitra Sengupta, Director, Lamron Analysts
Indicators also tend to falter under certain market conditions. For instance, tools like MACD or Parabolic SAR often generate false signals in sideways or choppy markets. And during speculative bubbles, markets can behave irrationally for longer than expected, making it even harder to rely on these tools. In momentum trading, where quick and clear decisions are essential, using fewer but well-matched indicators can provide better clarity.
To steer clear of this pitfall, stick to 2–3 complementary indicators that align with your trading strategy. For example, combine a trend indicator like Moving Averages with a momentum oscillator like RSI to gauge both the market’s direction and overbought/oversold conditions. Don’t forget to check the economic calendar before entering a trade. And when you spot a breakout, confirm it with a volume spike – price movements without strong volume often lack reliability, especially in momentum trading.
7. Neglecting Volume Confirmation
When it comes to validating momentum, volume confirmation plays a pivotal role. Think of volume as the engine that powers market movements. Without sufficient volume, even dramatic price shifts may lack the strength to sustain momentum. A volume surge accompanying a breakout is a key signal to watch for – it helps you steer clear of false signals that could lead to losses. This initial check lays the groundwork for a more detailed analysis of volume patterns.
High trading volume often indicates that institutional players are actively involved in the market move. This provides a level of confidence that the price action is legitimate, unlike a spike driven by weak participation. On the flip side, low volume during a price move suggests weak conviction, increasing the likelihood of a reversal. Soumitra Sengupta, Director at Lamron Analysts, explains it well:
“Volume is a critical indicator of the strength behind a stock’s move. Low volume may indicate a lack of conviction, while high volume can confirm a true momentum play”.
Here’s a quick look at how different volume patterns can signal various market conditions:
| Volume Pattern | Market Context | Signal Highlight |
|---|---|---|
| High Volume Spike | After a prolonged trend | Could signal a trend climax or potential reversal |
| High Volume + Narrow Range Bar | During an uptrend | Indicates possible distribution; suspect price action |
| Low Volume Breakout | At resistance/support | High risk of a false breakout or “trap” |
| High Volume + Wide Range Bar | At the start of a move | Confirms strong momentum and broad participation |
This table highlights how volume patterns can provide additional confirmation when paired with other technical indicators, giving traders a more complete picture.
Volume also ensures liquidity, which is essential for swift trade execution. Low-volume markets can make it difficult to buy or sell assets quickly, increasing the risk of slippage. Before acting on a breakout, always check for a volume spike to confirm active market participation. Tools like the Volume Weighted Moving Average (VWMA) can also help you spot potential breakouts earlier by focusing on price movements during high-volume periods.
Be cautious of high-volume bars with narrow ranges during an uptrend – this could hint at institutional distribution and a possible reversal. Once you identify such patterns, wait for confirmation from other trend indicators, like moving averages, before making your move. By sticking to this disciplined approach, you can avoid falling into the trap of false momentum signals.
Master Systematic Trading with Collin Seow
Learn proven trading strategies, improve your market timing, and achieve financial success with our expert-led courses and resources.
8. Confusing Pullbacks with Reversals
Mixing up pullbacks and reversals is a frequent mistake that can lead to poorly timed trades and losses. Here’s the difference: a pullback is a temporary price dip within an ongoing trend, while a reversal signals a complete shift in the trend’s direction. Recognising this distinction is crucial for effective momentum analysis.
The behaviour of prices around moving averages and momentum indicators often provides clarity. In an uptrend, for instance, a pullback typically sees prices bouncing off support levels, such as the 20- or 40-period moving average, while the broader trend remains intact. A reversal, on the other hand, is marked by short-term moving averages crossing below long-term ones, signalling a real trend change. Momentum oscillators like the Stochastic or CCI might dip into oversold territory during a pullback but usually recover as the price resumes its upward climb. Reversals, however, often show divergence – when prices hit new highs, but momentum indicators fail to follow, signalling weakening strength.
Volume is another critical factor. Pullbacks generally happen on lower or steady volume, indicating a lack of strong conviction behind the move. In contrast, reversals are often accompanied by sharp volume spikes, especially after a prolonged trend. These spikes can signal a “selling climax”, often tied to institutional distribution. As Marc Liu, a trading expert, explains:
“I like to use volume as it tends to be a leading indicator, which can warn of a potential price reversal. Note it does not confirm price reversal but increases the odds of it happening”.
To refine your analysis, consider using multiple timeframes. For example, a dip on a daily chart might just be noise in the context of a larger monthly uptrend. A true reversal, however, will show consistent signals across several timeframes. Look for confirmation through trend indicators and volume spikes. If a pullback respects key support levels and momentum indicators recover, it’s more likely a pullback than a reversal. By following this disciplined approach, you can avoid jumping the gun and significantly improve your trade timing.
9. Letting Emotions Drive Decisions
Momentum trading often falters when emotions like fear and greed take the wheel, disrupting disciplined strategies and leading to impulsive decisions.
Fear can paralyse traders in several ways. It might cause analysis paralysis, where constant market noise leaves you frozen, unable to act. Or, it can lead to panic-selling during routine market pullbacks, prompting you to exit positions just before momentum rebounds. Greed, on the other hand, is just as dangerous. It pushes traders to chase trades after momentum has already peaked or tempts them to ignore risk controls during a winning streak, leading to overconfidence. And after a loss, revenge trading often follows – reckless attempts to recover losses that stray far from the original plan.
These emotional traps can wreak havoc on your strategy, making it essential to adopt strict measures to stay on track. The difference between systematic trading and emotional trading is striking. Systematic approaches stick to predefined rules and technical signals, maintaining consistency even in volatile markets. In contrast, emotional trading relies on gut feelings and reactions to news, which can create intense psychological pressure. Research reveals that investor sentiment plays a role in market volatility, with algorithmic trading reducing intraday return volatility by 0.817 for every unit increase in systematic activity. In fact, sentiment-driven trading accounts for about 25% of this volatility reduction.
To keep emotions in check, consider applying the 1–2% Rule – limit your risk on any single momentum trade to just 1–2% of your total trading capital. Automated stop-loss orders can also help by closing losing trades automatically, removing emotion from the equation. As Benjamin Graham aptly said:
“The best way to measure your investing success is not by whether you’re beating the market but by whether you’ve put in place a financial plan and a behavioural discipline that are likely to get you where you want to go”.
Another helpful tactic is maintaining a trading diary. By recording both the technical reasons behind your trades and your emotional state at the time, you can identify patterns in your behaviour and address recurring issues. Finally, adopting rule-based models can replace impulsive decisions with consistent, systematic execution.
10. Failing to Plan Trades
When it comes to momentum trading, having a clear plan isn’t just helpful – it’s essential. Without a trading plan, you’re left to rely on impulse rather than a well-thought-out strategy. Think of your plan as a map that helps you navigate the unpredictable swings of the market, shielding you from being overwhelmed by noise or distractions. Without it, decisions can quickly be driven by gut feelings, social media chatter, or sensational news headlines instead of sound logic.
A lack of planning often leads to common pitfalls like FOMO (fear of missing out), pushing you to jump in at the peak of momentum. Without clear exit rules, even profitable trades can spiral into losses. A solid plan also prevents greed from pushing you into oversized positions.
So, what makes a good trading plan? It should clearly define measurable entry criteria, such as moving average crossovers or volume spikes, rather than relying on vague signals. It should also include pre-set stop-loss orders and profit targets, which help keep emotions in check when the market moves. Aiming for a risk-reward ratio of at least 1:2 can allow you to stay profitable even if only half of your trades are successful.
Another key element is maintaining a trading journal. Use it to track metrics like your win rate, profit factor, and maximum drawdown. Reviewing this data regularly helps you identify patterns in your behaviour and pinpoint impulsive triggers.
“Consistency comes from following your trading plan, maintaining emotional control, and regularly reviewing your performance.” – Trade with the Pros
As you gain experience and markets evolve, so should your trading plan. Backtesting and demo-testing your strategy are crucial steps before committing real money.
Conclusion
Steering clear of common trading mistakes not only protects your capital but also sets the stage for long-term success in the markets. Momentum trading, with its fast-paced nature, requires sharp focus, disciplined risk management, and a systematic decision-making process.
The foundation of trading success lies in mastering the basics. When you combine various indicators, validate movements with volume, enforce consistent risk controls, and keep a detailed trading journal, you transition from impulsive, emotional decisions to a structured, rule-based approach. This kind of consistency allows you to navigate shifting market conditions – whether they’re trending or range-bound – without being caught off guard. It’s a method that ties together both the technical skills and emotional discipline necessary for effective trading.
Continuous learning is what separates traders who merely survive from those who truly excel. For those looking to deepen their skills, Collin Seow Trading Academy offers resources like the free Market Timing 101 e-course, The Systematic Trader v.2 book, and the Systematic Trader Programme. These tools are designed to help traders develop clear, objective entry and exit strategies.
“Collin’s mission extends beyond the trading floor; he aims to foster a community of systematic traders through CollinSeow.com, empowering his students with the tools and insights needed for responsible investing and enduring success.”
– Collin Seow Trading Academy
FAQs
What’s the difference between a pullback and a reversal in momentum trading?
In momentum trading, a pullback refers to a brief dip or correction that occurs within an ongoing trend. It’s like a pause before the trend picks up again. On the other hand, a reversal marks a complete shift in the trend’s direction. This shift can often be spotted through signs like fading momentum, volume divergence, or breaking through important support or resistance levels.
The key to telling them apart lies in the price action. If the price eventually moves back in line with the original trend, it’s likely a pullback. However, if the price continues in the opposite direction for an extended period, it’s probably a reversal. Understanding these patterns can guide you in making smarter trading decisions.
How does trading volume confirm momentum in the market?
Volume plays a crucial role in understanding momentum, as it reveals the strength driving price changes. When prices climb on high volume, it typically signals strong buying interest, reinforcing the upward trend. On the other hand, if price movements occur on low volume, it may point to weak conviction, hinting at potential reversals or a lack of momentum.
For better decision-making, traders should pair volume analysis with other indicators and factor in the broader market context. This combined approach helps minimise the risk of relying solely on volume, which can occasionally produce misleading signals.
Why is it dangerous to depend only on technical indicators for momentum analysis?
Relying solely on technical indicators for momentum analysis can be a slippery slope. These tools often produce false signals and overlook the bigger picture, such as the broader market context or critical fundamental factors. In volatile or unpredictable markets, this can lead to decisions that miss the mark.
A smarter approach? Pair technical indicators with other strategies. For example, look at market trends, dive into economic data, or keep an eye on industry news. This way, you’ll get a more well-rounded understanding of the market and make better-informed trading decisions.