
Gold Outlook: Safe-Haven Demand Drives the Rally
Lingering geopolitical tensions reaffirm spot gold’s long-term uptrend.
However, the yellow metal is now approaching a key psychological barrier that could at least temporarily halt the rally.
Safe-haven bids related to geopolitical developments in Iran, Venezuela, and Greenland have pushed gold to yet another record high. In the process, momentum on longer-term charts has hit its highest at least since the 1970s.
Momentum Warning: RSI at Extreme Overbought Levels
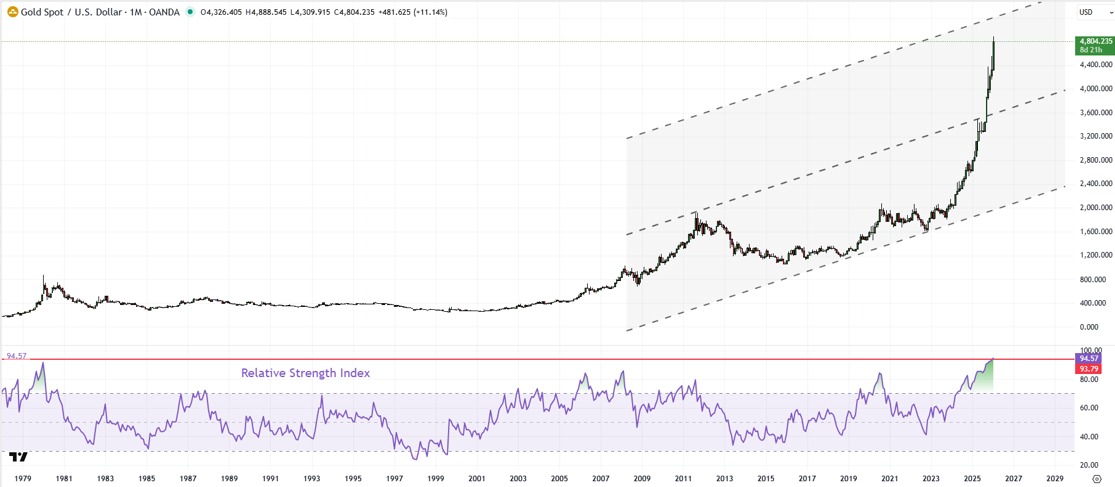
The 14-month Relative Strength Index (RSI) currently stands at 94, significantly above the 70-mark classified as overbought territory.
The RSI is a bounded indicator that rotates within 0-100. RSI levels close to 100 tend to be unsustainable, resulting in a retreat in price, and at times, abruptly.
Spot Gold (XAUUSD; Monthly)
Psychological Resistance: Can Gold Break the 5000 Level?
Moreover, gold is approaching the psychological 5000-mark, pointing to some consolidation at the very least. In 2011, after hitting a new peak, gold retreated from the psychological 1000-mark.
To be fair, the catalyst for an imminent setback seems to be lacking. And in the absence of a strong catalyst, the path of least resistance remains up for the yellow metal.
Worries about ballooning US debt are prompting a reassessment of the US dollar as a global reserve currency. Media reports suggest that a Danish pension fund plans to sell $100 million of US Treasury bonds due to concerns over US public finances.
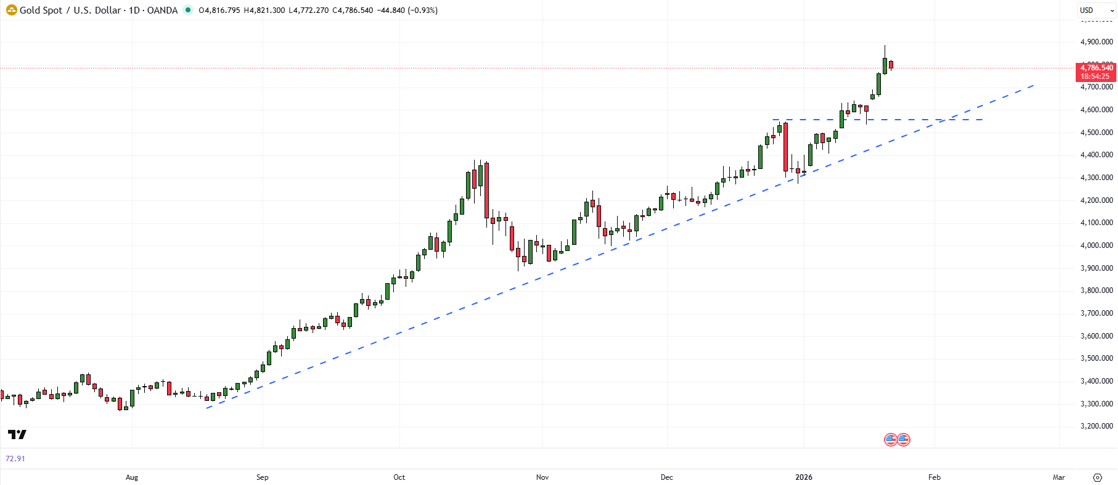
Spot Gold (XAUUSD; Daily):
Structural Demand: Central Bank Buying and FX Reserve Diversification
Global central banks have been diversifying into gold as a store of value. Diversification of FX reserves is one of the major structural demand components that have contributed to the strong upward trajectory of the yellow metal.
And recent developments related to Iran, Venezuela, and Greenland are unlikely to alter the trend. Questions regarding the US central bank’s independence could shift the tide further in favour of the non-yielding gold.
Billionaire investor Ray Dalio said in Davos that countries holding large amounts of US dollars and Treasurys may become less willing to finance US deficits if trust erodes.
Long-Term Bull Case: Could Gold Reach 8000 by 2028?
Given these structural shifts in the capital flows landscape, it wouldn’t be inconceivable that gold eventually surpasses the psychological 5000 mark. Some expect gold to hit 8000 by 2028.
On the downside, there is immediate support at the December high of 4550, near support on an uptrend line from April 2025 (which comes in at about 4450), followed by quite strong support at the end-of-December low of 4275.
Gold would need to fall below 4275 for the upward pressure to fade.
FAQ
Why is gold rising amid geopolitical tensions?
Ongoing geopolitical risks and uncertainty have increased safe-haven demand, pushing gold to new record highs.
Is gold overbought at current levels?
The 14-month RSI is around 94, well above the 70 overbought threshold, suggesting the rally may pause or consolidate.
How do US debt concerns affect gold?
Rising US debt and questions over dollar dominance are prompting investors and institutions to diversify into gold.
What are the key downside support levels?
Immediate support is near 4550, followed by 4450, and stronger support around 4275. A break below 4275 would weaken the bullish bias.