
About the Security (NASDAQ: MRNA)
Moderna, Inc. is an American pharmaceutical and biotechnology company based in Cambridge, Massachusetts, that focuses on RNA therapeutics, primarily Messenger RNA vaccines (mRNA).
Stock background:
At the 44th Annual JP Morgan Healthcare Conference earlier this week, the company said it expects to report higher than initially projected revenues for the full year 2025.
For the current year 2026, the company reiterated its plans to deliver up to 10% growth and further lower its operating expenses, on the path to achieving breakeven in 2028.
Healthcare Sector Context and Vaccine Demand Shift
Moderna has been facing some challenges on the financial front as the demand for COVID-19 vaccines has fallen off a cliff in recent years.
To be fair, in general, US healthcare stocks have underperformed in recent years. However, since the end of last year, upward momentum for the sector has been improving.
In the conference, the company also highlighted its strategy to create a seasonal respiratory vaccine franchise that could serve as a durable cash engine. The company is due to report its fourth quarter and full-year 2025 results on February 13.
Moderna (Weekly chart):
Technical Analysis on Moderna (NASDAQ: MRNA)
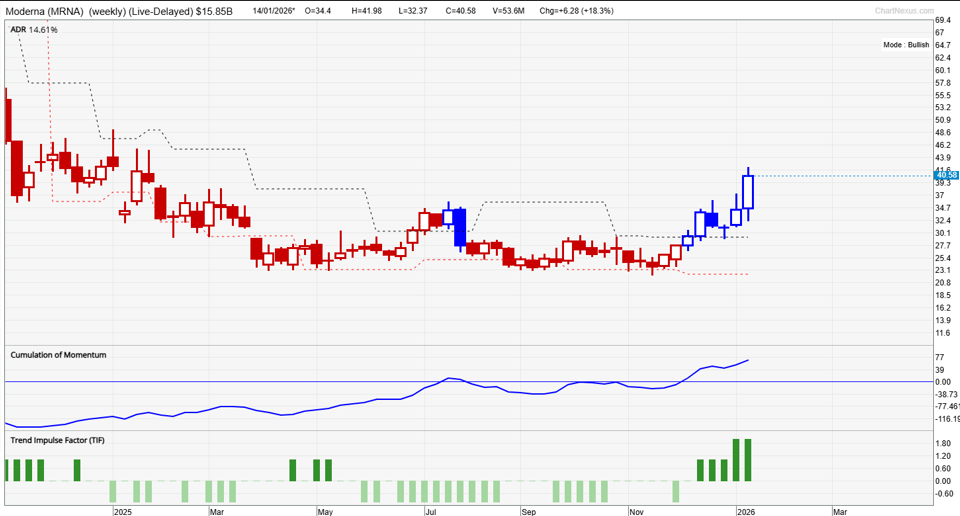
Our proprietary system, TradersGPS (TGPS), decidedly turned bullish on the weekly charts at the end of last year. Typically, signals on the weekly charts have implications for the trend over a multi-month timeframe.
As per our system, Blue candles indicate the stock’s trend is up. Red candles indicate the trend is down.
Momentum Turns Bullish as Resistance Breaks
The previous instance of blue candles in mid-2025 failed to last in the absence of a meaningful resistance break. However, this time around, blue candles are not only consistently blue, but most of them are wide, suggesting improved upward momentum.
Furthermore, the stock has broken above vital resistance at the mid-2025 high of 35.60, breaking out of a multi-month sideways pattern.
Moderna (Weekly chart):
Key Levels: Upside Toward 48.90 and 78.00, Support at 22.00
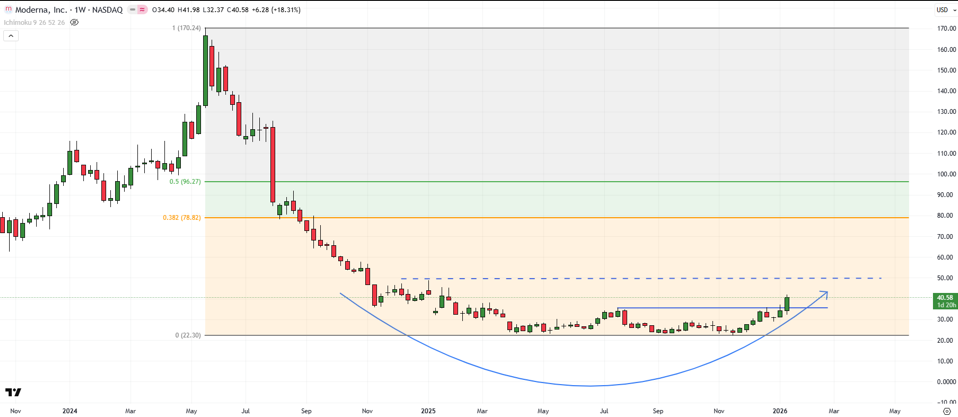
On the weekly candlestick charts, the chart pattern since 2024 resembles a rounding saucer pattern, which generally occurs at lows.
The break above resistance at 35.50 has opened the way initially toward the January 2025 high of 48.90. Significant resistance comes in at 78.00 (the 38.2% retracement of the 2024-2025 slide).
On the downside, the stock needs to hold above the 2025 low at 22.00 for the near-term bullish bias to remain force.
FAQ
Why did Moderna’s stock break higher?
The company guided to higher-than-expected 2025 revenues and reiterated growth and cost-reduction plans for 2026, improving investor confidence.
What does TradersGPS indicate for Moderna?
TradersGPS has turned Bullish on the weekly chart, with consistent blue candles signalling improving multi-month momentum.
What resistance did Moderna break?
The stock broke above the mid-2025 resistance near 35.60, ending a multi-month sideways pattern.