Trading on GDP release dates can be tricky, but having a clear plan makes all the difference. GDP data directly impacts markets by influencing interest rates, central bank policies, and economic forecasts. Here’s how you can prepare:
- Confirm the release date and time: Use official sources like SingStat or MTI to avoid errors.
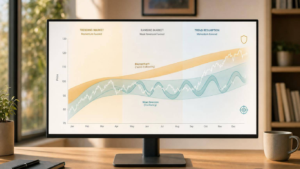
- Understand forecasts and trends: Compare GDP expectations with historical data. For instance, Singapore’s 2026 GDP is projected to grow between 1.0% and 3.0%.
- Review related indicators: Metrics like the Industrial Production Index, SIPMM PMI, and trade data provide context.
- Set your trading strategy: Identify your bias, manage risk (limit losses to 1%-2% of your capital), and use tools like stop-loss orders.
- Choose trading instruments: Focus on SGD/USD, the Straits Times Index, or high-volume stocks tied to key sectors like manufacturing and finance.
- Monitor real-time reactions: Watch for surprises versus consensus expectations, as these drive market volatility.
- Document and review trades: Post-trade analysis helps refine your approach for future opportunities.
This checklist ensures you’re prepared, maintain trading discipline, and are ready to navigate the volatility of GDP announcements.
Preparation Before GDP Release
Confirm GDP Release Date and Time
Start by checking the Advance Release Calendar from SingStat or the Ministry of Trade and Industry (MTI) for the upcoming GDP data release. Be sure to differentiate between the Advance GDP Estimates and the Final GDP figures. For example, in 1Q 2026, the Advance GDP Estimates are scheduled for release by 14 April, while the Final GDP figures will be available by 26 May 2026.
Pay attention to the “NLT” (Not Later Than) notation – it means the data will be released by the specified date. From January 2026 onwards, if a release date falls on a non-working day, it will be shifted to the next working day. Always use economic calendars set to SGT (UTC+8) to avoid time zone conversion mistakes. If you’re relying on third-party trading calendars, cross-check them with official government sources to ensure the release date hasn’t been updated from a “TBC” (To Be Confirmed) status .
Once the release date is confirmed, take some time to review GDP forecasts and historical data to better understand the context of the upcoming figures.
Review GDP Expectations and Historical Trends
After confirming the release schedule, dive into forecast reports and historical trends to set expectations. Reports from MTI and the Monetary Authority of Singapore (MAS) are particularly useful for this. For instance, in November 2025, the MTI revised its GDP growth forecast for 2025 to “around 4.0 per cent”, up from an earlier range of 1.5 to 2.5 per cent. This adjustment followed a strong Q3 performance where the economy expanded by 4.2% year-on-year, driven by a 6.1% surge in the electronics cluster, largely due to demand for AI-related products. Looking ahead to 2026, growth is expected to moderate to a range of 1.0 to 3.0 per cent.
When analysing data, focus on both Year-on-Year (YoY) and Quarter-on-Quarter (QoQ) trends to identify growth drivers. For example, if YoY growth is positive but QoQ shows a contraction, it could signal a slowing economy. Keep an eye on external influences, such as US Federal Reserve decisions and China’s Manufacturing PMI, as these factors can significantly impact Singapore’s export-driven economy .
Check Related Economic Indicators
To gain a well-rounded view of the market, examine other economic indicators alongside GDP data. Key metrics include the Industrial Production Index and the SIPMM PMI, which are major contributors to Singapore’s GDP . Trade data is also crucial. For instance, in November 2025, Total Merchandise Exports grew by 10.0% year-on-year, while Non-Oil Domestic Exports (NODX) increased by 11.6% .
Additionally, labour market statistics can offer insights into the economy’s health. In November 2025, Singapore recorded a 2.0% unemployment rate and a 1.2% Consumer Price Index (CPI), which could hint at potential central bank policy adjustments . Given that Singapore’s SORA (Singapore Overnight Rate Average) closely tracks the US Federal Funds Rate, it’s also essential to review US employment data and Federal Reserve meeting minutes to anticipate any shifts in monetary policy.
sbb-itb-466c9b0
Pre-Release Trading Setup
Define Trading Strategy and Bias
Start by confirming the GDP release date and analysing forecasts to establish a directional bias. Compare the consensus forecast with previous GDP values and historical trends. For instance, Singapore’s GDP growth for 2026 is expected to range between 1.0% and 3.0%. If the actual figure falls significantly outside this range, markets could see increased volatility. A larger-than-expected miss or beat relative to forecasts often triggers sharp movements, especially in currency markets.
To refine your bias, adopt a top-down technical analysis approach. Begin by examining longer time frames, such as weekly or 60-minute charts, to gauge the primary trend. Then, move to shorter time frames, like 5- or 15-minute charts, to pinpoint specific entry points. Use technical indicators such as PMI, CCI, and BCI, and assess broader market sentiment with tools like the CBOE VIX, Put/Call ratios, or the High-Low Index. Once your bias is clear, proceed to define your risk parameters.
Set Position Sizing and Risk Parameters
Decide the amount of risk capital for each trade. Limit your risk to 1%–2% of your total trading capital on any single position. For example, if you have a S$50,000 account and risk 1% per trade, your maximum allowable loss would be S$500. To calculate your position size, use this formula: (Account Equity × Risk Percentage) ÷ Risk per Share. Here, the risk per share is the difference between your entry price and your stop-loss level.
Given the heightened volatility during GDP announcements, consider reducing your position sizes further to account for larger-than-normal price swings. Be cautious of gap risk, where prices may jump past your stop-loss levels during the release. To mitigate this, use Guaranteed Stop Loss Orders (GSLOs), which ensure you exit at a specific price even if the market gaps. Alternatively, place stop-loss orders just beyond typical volatility ranges or use metrics like the Average True Range (ATR) to set stops adjusted for market fluctuations. If you’re trading Singapore stocks, ensure your position size aligns with SGX‘s round-lot requirements.
Select Trading Instruments
Once your strategy and risk parameters are set, focus on instruments that are most responsive to GDP data. For Singapore, the SGD/USD currency pair is a key choice, as GDP figures can influence the Monetary Authority of Singapore’s decisions regarding the S$NEER policy band. Broader market indices, such as the Straits Times Index (STI), or ETFs tracking the STI, are also effective tools for gauging overall economic sentiment. When trading individual stocks, prioritise high-volume equities – those with daily trading volumes exceeding 500,000 shares on the SGX – for better liquidity and more reliable technical signals.
Also, consider sector-specific dynamics. Singapore’s GDP is largely driven by manufacturing (particularly electronics and biomedicals), finance and insurance, and wholesale trade. If you anticipate the GDP data will highlight strengths or weaknesses in these areas, look at ETFs or stocks tied to these sectors. To manage volatility, use limit orders or tiered entry strategies, which can help improve your average entry price, especially during the low-liquidity periods around the GDP release. Before the market opens, identify stocks showing price gaps of at least 1% and above-average volume, as these are often momentum signals tied to GDP-related news.
Actions During the GDP Release
Monitor the Announcement in Real-Time
To stay updated on GDP releases, use economic calendars that compare “Consensus” and “Actual” figures as soon as the data is announced. For traders in Singapore, the POEMS Economic Calendar is a handy tool, as it shows timings in Singapore Time (SGT), avoiding any confusion with time zones.
For the most reliable data, refer to SingStat or the Ministry of Trade and Industry (MTI), which publish Singapore’s Advance GDP Estimates about two weeks after the end of each quarter.
If you’re tracking multiple markets, platforms with real-time quotes and advanced charting tools can be useful. For those on the go, the Realtime Stock Screener helps monitor price gaps and volume surges in real time. You can even set alerts for stocks showing price gaps of 1% or more and above-average trading volumes. Once the data is out, observe how the market initially reacts to these figures.
Watch Initial Market Reactions
The first few minutes after the GDP release are critical. This is when the market shows whether it’s reacting to a “beat” or “miss” compared to consensus expectations. Keep in mind that the consensus is often priced into the market before the announcement, so surprises are what typically drive volatility. Strong GDP growth tends to boost equities, while weaker growth often benefits bonds as it reduces the likelihood of interest rate hikes.
Pay attention to both price movements and trading volumes. A breakout on low volume during the release may not hold once institutional traders step in. Interestingly, stocks that rise pre-market during high-impact events like GDP releases have only a 52.4% chance of continuing their gains intraday. Use tools like the VIX (volatility index) or ATR (average true range) to measure the intensity of market reactions. For example, a VIX reading above 30 suggests heightened volatility.
Execute or Adjust Trades Based on Market Movement
If the market confirms your trading bias, execute your trades using limit orders. For larger positions, consider staggering your entries to manage risk. However, if the actual GDP data or the initial market reaction contradicts your thesis, don’t hesitate to cancel or adjust your pending orders.
To protect against sudden price gaps, use guaranteed stop-loss orders (GSLOs). During volatile periods, you might want to widen your stop-loss levels by 0.5% to 1% to account for slippage.
In fast-moving markets like those during GDP releases, it’s wise to lock in profits sooner. Aim for gains in the range of 15–20% instead of holding out for 30–40%. Always validate breakouts by checking if they’re backed by strong volumes – price spikes without institutional support can reverse quickly. Finally, resist the urge to trade impulsively right after the news drops. Take a moment to ensure your decisions are guided by strategy, not emotion.
Master Systematic Trading with Collin Seow
Learn proven trading strategies, improve your market timing, and achieve financial success with our expert-led courses and resources.
Post-Release Trade Management
Monitor Secondary Market Reactions
Market reactions to Singapore’s GDP releases often evolve gradually. The initial price movement might not reveal the full picture – it’s common to see counter-moves as institutional traders process and respond to the data more thoroughly.
Pay close attention to GDP revisions. Singapore’s GDP figures are released in three stages: the advance estimate (usually within the first month after the quarter ends), the preliminary estimate (about a month later), and the final estimate (a few weeks after the preliminary). The relationship between these updates often tells a bigger story than any single figure. For instance, if the final GDP reading falls below the advance estimate, it can dampen market sentiment significantly.
Look at sector-specific performance for follow-up opportunities, especially when there’s a mismatch between the overall GDP numbers and industry-specific trends. Keep tabs on related indicators that might influence monetary policy decisions, such as changes in interest rate expectations or inflation signals from the GDP price index. Given Singapore’s export-driven economy, monitoring GDP results from key trading partners like the US and China is equally important. These insights can help assess potential ripple effects on local markets and currency pairs [2, 11]. Together, these evolving data points and sector trends form the foundation for effective post-release trade analysis.
Review and Document Trade Outcomes
Once the initial market turbulence settles, take the time to document your trade details. Record your entry and exit points, profit or loss, volume trends, and the specific news events that influenced the market during the release. Keeping detailed records turns each trade into a valuable learning experience.
Compare your pre-release analysis with what actually happened. Did the technical levels you identified hold up? Were there emotional factors that affected your decisions? Trading psychology plays a huge role in success – some experts believe it accounts for 80% of outcomes, compared to only 20% from technical skills. Reflecting on moments when fear or excitement influenced your actions, especially during high-volatility periods, can help refine your approach for future trades.
Additionally, evaluate your execution metrics. Note whether your limit orders were filled or missed. If you use “Gap and Go” strategies, observe how gaps larger than 4% performed – did they lead to successful momentum trades? Use these insights to tweak your order placements, testing adjustments with smaller trades to ensure they work effectively.
Risk Management Practices
Manage Volatility Risks
GDP announcements often lead to sharp market movements. To prepare, keep an eye on the CBOE Volatility Index (VIX). If it exceeds 30, it signals extreme volatility. In such conditions, the best approach might be to step back and wait for the market to stabilise before trading.
Another way to manage volatility is by adjusting your position sizing method using the Average True Range (ATR). If the ATR exceeds 3% of the asset’s price, consider using minimal or no leverage. For instance, if you’re trading the Straits Times Index and the ATR jumps from 1.5% to 3.5% ahead of a GDP release, reducing your leverage can help protect your capital from sudden price swings. This adjustment complements your existing risk measures, ensuring a disciplined approach during high-impact events.
In periods of heightened volatility, widen your stop-losses by 0.5%–1% and use Guaranteed Stop-Loss Orders (GSLOs). These orders protect you from sudden price gaps that might bypass regular stop-loss triggers. Studies show that traders using stop-loss orders experience a 65% reduction in emotional stress during market downturns.
“Position sizing is the glue that holds together a sound trading system.” – Brijesh Bhatia, Equity Capital Market Analyst, Definedge
Discipline is key – 90% of traders lose money not because their strategies are flawed but because they lack self-control. If the market conditions, such as excessive volatility or conflicting news, don’t align with your trading plan, sometimes the smartest move is to sit out and avoid trading altogether.
Once you’ve addressed volatility, the next step is to manage your overall portfolio exposure.
Limit Portfolio Exposure
To minimise risk, limit your GDP-related trades to 10%–20% of your portfolio. Diversifying in this way can help cushion the impact of any unexpected market reactions to GDP data.
Stick to the 1%–2% rule: risk only a small portion of your total trading capital on a single trade. Use the following formula to calculate your position size consistently:
Number of shares = (Account equity × Risk percentage) ÷ Risk per share.
Here’s an example calculation:
| Component | Example Calculation (SGD) |
|---|---|
| Total Account Equity | S$50,000 |
| Risk Percentage (1%) | S$500 |
| Entry Price | S$10.00 |
| Stop-Loss Price | S$9.50 |
| Risk Per Share | S$0.50 |
| Calculated Position Size | 1,000 shares |
Singapore’s trade-to-GDP ratio was an enormous 311.24% in 2023, highlighting the local market’s sensitivity to global trade data. This interconnectedness means GDP announcements can lead to ripple effects across various positions. To safeguard your portfolio, consider reducing position sizes or hedging with put options before the data release. For Singapore-listed stocks, remember to factor in round-lot requirements when calculating your final position size.
“I’m always thinking about losing money as opposed to making money. Don’t focus on making money, focus on protecting what you have.” – Paul Tudor Jones
Conclusion
Trading on GDP releases demands a disciplined approach that blends careful preparation, methodical execution, and strict risk management. The checklist in this article serves as a guide to help you handle the market’s volatility during these announcements. From confirming release times and analysing trends to setting your bias and calculating position sizes, these steps ensure you stay objective when the market reacts. This structured framework reinforces the principles discussed earlier.
Achieving success in trading hinges more on discipline than technical know-how. Without a clear routine and defined trading plans – such as deciding what to trade, when to trade, and how much to trade – even the most advanced analysis can falter under pressure. As Collin Seow aptly puts it:
“Without the right mindset, you won’t be able to follow your strategy and will disregard risk when the time comes”.
Equally important is post-trade documentation. By recording and reviewing your trades, you can fine-tune your strategies and develop habits that set consistent traders apart from those who depend on luck.
To support your systematic trading journey, the Collin Seow Trading Academy provides tools and resources designed to eliminate emotional decision-making. The Systematic Trader Program (SMT), which has earned over 1,400 5-star reviews on Seedly, offers a structured approach to identifying high-probability setups and managing risks effectively. Additionally, free resources like the Market Timing 101 E-Course and Systematic Trading Profits webclass are available at https://collinseow.com to help you strengthen your trading foundation.
FAQs
What are the best ways to manage risk when trading on GDP release dates?
Managing risk during GDP release dates calls for thoughtful planning and a disciplined approach. Start by consulting the economic calendar to pinpoint the exact time of the GDP announcement in Singapore Time (SGT). It’s also important to understand the market consensus, as unexpected results can trigger sharp price swings.
Keep your position size small by risking only a small percentage of your trading capital – say, 1–2%. Use stop-loss orders to protect yourself from sudden price gaps. For better accuracy, consider using an ATR-based stop to adjust for market volatility. Aim for a solid risk-reward ratio, like 1:3, and spread your trades across different assets to avoid putting all your eggs in one basket.
Once the data is out, stick to your plan. Avoid making hasty decisions based on immediate market reactions. By following this structured approach, you can handle high-impact events like GDP announcements with greater confidence and control.
What key economic indicators should traders monitor alongside GDP data?
When Singapore’s GDP figures are released, traders often turn to other economic indicators to get a clearer picture of the overall economic situation. Some of the key metrics they focus on include inflation rates (like the Consumer Price Index), employment data (such as Singapore’s unemployment rate or the US Non-Farm Payrolls), and central bank decisions on interest rates. These elements can play a big role in shaping how markets respond to GDP updates.
Traders also keep an eye on leading indicators like the yield-curve spread, changes in benchmark interest rates, and stock market performance. Additional data points, such as consumer confidence surveys, retail sales numbers, manufacturing PMI, and trade balance statistics, provide valuable insights into specific industries and economic trends.
For those trading in Singapore, Collin Seow Trading Academy offers e-courses and webinars designed to help you understand these indicators. Their programmes teach how to integrate this data into a structured trading plan, giving you the tools to handle market movements during GDP release days with greater confidence.
How can I select the best trading instruments for GDP release days?
To pick the best trading instruments for GDP release days, start by marking the GDP announcement date on your economic calendar. Pay attention to the forecasted figure and previous data, as GDP surprises can lead to notable market movements. This is particularly true for currency pairs like USD/SGD or EUR/USD, as well as equity index futures such as the SGX Straits Times Index or the US S&P 500 ETF. Currencies offer a direct reflection of economic growth, while index futures and ETFs capture broader market reactions.
From there, refine your choices based on your trading style and how much risk you’re comfortable taking. If you’re looking for lower-risk options, consider trading options on futures or ETFs. These limit your potential loss while still letting you take advantage of market volatility. Before diving in, do a quick pre-market scan to spot price gaps or early movers. Use technical analysis to pinpoint critical support and resistance levels, which can guide your entry and exit points.
Lastly, manage your position wisely. Set stop-loss orders to protect your capital and consider systematic tools like TradersGPS to stay disciplined and avoid emotional decisions. By tailoring your strategy to the market’s reaction to the GDP release, you can approach trading with greater confidence and precision.