Order books are key to understanding stock price movements. They show real-time buy and sell orders, helping traders gauge market liquidity, price levels, and potential price trends. Here’s what you need to know:
- Order book basics: Displays buy (bid) and sell (ask) orders, including prices and volumes. The difference between the highest bid and lowest ask is the bid-ask spread, a measure of trading costs and liquidity.
- Price impact: Imbalances in order flow (more buy orders than sell orders or vice versa) often predict short-term price changes. Stocks with deeper order books (more liquidity) experience smaller price movements for the same trade size.
- Key events: Limit orders add liquidity, market orders consume liquidity, and cancellations can thin the order book, affecting price stability.
- Trading strategies: Use metrics like Order Flow Imbalance (OFI), market depth, and spread analysis to time trades, manage costs, and reduce risks during volatile periods.
Understanding these dynamics helps traders make better decisions, reduce execution costs, and navigate volatile markets.
Order Book Events That Move Stock Prices
Types of Order Book Events
The order book is a dynamic space where three key events – limit orders, market orders, and order cancellations – can significantly influence stock prices.
- Limit Orders: These orders add liquidity by setting a specific price at which traders are willing to buy or sell. Large limit orders placed near the bid-ask spread often act as strong indicators of support or resistance levels in the market.
- Market Orders: Unlike limit orders, market orders consume liquidity by executing immediately at the best available price. Since they match against existing orders, market orders can lead to sudden and sharp price changes as the market adjusts to the next available price level.
- Order Cancellations: When traders cancel orders, they remove liquidity from the order book, leaving it thinner and more sensitive to subsequent trades. For instance, cancelling a large sell order might ease downward pressure on a stock, while cancelling a significant buy order could weaken its price support.
Large block trades – those exceeding 10,000 shares – tend to have a noticeable impact on prices, ranging from 0.2% to over 1.0%, depending on the trade size and current market conditions. These events directly influence order flow imbalances, which are a driving force behind price fluctuations.
Order Flow Imbalance and Price Changes
Order flow imbalance (OFI) is a critical metric that tracks the net difference between buy and sell order volumes over short periods. This imbalance is a powerful predictor of price movements, highlighting the direct link between order book activity and stock price changes.
A positive OFI occurs when buy orders significantly outpace sell orders. For example, if UOB sees SGD 500,000 in buy orders compared to SGD 200,000 in sell orders, this positive imbalance can drive the stock price higher as the available sell orders are consumed. Conversely, when sell orders dominate, prices typically decline as sellers work through buy orders at progressively lower levels. High-frequency trading systems are particularly adept at capitalising on these imbalances, often reacting within 50 to 500 milliseconds.
This dynamic underscores how order book activity shapes broader market trends and price behaviour.
Market Depth and Price Movements
Market depth – the volume of buy and sell orders at various price levels – plays a crucial role in determining how much a trade impacts a stock’s price. There’s an inverse relationship between liquidity and price volatility: stocks with deeper order books experience smaller price movements for the same order flow, while thinner markets are more prone to significant price swings.
For example, executing a SGD 1 million buy order in DBS Group Holdings, known for its substantial market depth, might move the price by about 0.3%. However, placing the same order in a smaller SGX-listed stock with limited depth could lead to a price movement of 2% or more.
Here’s a quick look at typical price impacts based on trade size:
| Trade Size (Shares) | Average Price Impact |
|---|---|
| 10,000–25,000 | 0.2%–0.5% |
| 25,000–50,000 | 0.5%–1.0% |
| 50,000+ | >1.0% |
Deeper markets provide natural price stability, especially during volatile periods or major news events, while shallow markets can amplify price swings. For highly liquid stocks, market makers often maintain tight bid-ask spreads, sometimes as low as SGD 0.01. In contrast, less liquid stocks might see spreads of SGD 0.05 or more. These spreads help traders estimate execution costs and minimise slippage, particularly when planning larger trades during low-liquidity periods.
Understanding market depth is essential for timing trades effectively. Platforms like Collin Seow Trading Academy offer resources and courses to help traders interpret order book events and use market depth data for better trade execution and risk management.
Bid-Ask Spreads and Liquidity Effects
Understanding Bid-Ask Spreads
The bid-ask spread – the difference between the highest price a buyer is willing to pay (bid) and the lowest price a seller is willing to accept (ask) – is a key indicator of market liquidity and trading costs. On the Singapore Exchange (SGX), for instance, well-traded blue-chip stocks like DBS Group Holdings often have tight spreads of just SGD 0.01. In contrast, smaller-cap stocks may show wider spreads, such as SGD 0.05 or more, reflecting their lower liquidity.
This spread directly affects your trading costs. When you buy a stock, you pay the ask price; when you sell, you receive the bid price. The difference between these two prices represents the cost of a round-trip trade. For traders, understanding and accounting for this cost is essential when planning their strategies.
“A narrower bid-ask spread not only reduces trading costs but also reflects a more liquid market, which is essential for efficient price discovery.” – Collin Seow, Trading Expert, CollinSeow.com
This concept is critical for grasping how changes in spreads can shape market behaviour.
How Spread Changes Affect Prices
Tighter spreads often lead to increased trading volumes and more stable prices. On the SGX, spreads are typically narrower during peak trading hours, such as between 9:00 am and 12:00 pm SGT, when market activity is at its highest. Conversely, spreads may widen during lunch breaks or near market close, which can impact the quality of trade executions.
Studies suggest that a 1% reduction in the bid-ask spread can result in a 0.5% increase in trading volume. This relationship becomes especially relevant during key events like earnings announcements or economic updates. Sudden changes in spreads during such periods can significantly influence trading costs, making it important for traders to time their trades carefully and manage associated risks.
Liquidity Shocks and Market Activity
Liquidity shocks – sudden changes in market liquidity – can disrupt trading conditions in an instant. These events often occur during major news releases, earnings reports, or periods of market stress, causing bid-ask spreads to widen and creating a more volatile trading environment.
A notable example occurred during the COVID-19 pandemic when Singapore Airlines‘ spread widened from SGD 0.01 to SGD 0.05, leading to higher transaction costs and increased market volatility.
“Liquidity shocks can significantly alter market dynamics, leading to wider spreads and increased volatility, which traders must navigate carefully.” – Collin Seow, Trading Expert, CollinSeow.com
Even a single block trade of 25,000 shares can widen spreads – for example, from SGD 0.02 to SGD 0.06 – and shift prices by 0.5% to 1.0%. During periods of heightened volatility, keeping an eye on widening spreads, reduced market depth, and unusual trading volumes can serve as early warning signs of liquidity challenges.
To manage such situations, platforms like Collin Seow Trading Academy provide resources on systematic trading strategies, including how to analyse spreads and liquidity. Adjusting position sizes, widening stop-loss orders, or temporarily scaling back trading activity are practical ways to navigate the higher costs and risks associated with volatile market conditions.
Order Book Patterns and Trading Signals
How Different Price Levels Affect Future Prices
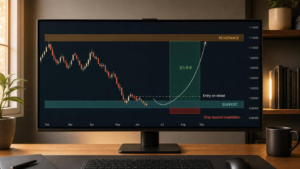
The way orders are distributed in the order book can often hint at where prices are heading. When a large number of orders cluster around certain price levels, these points frequently act as support or resistance zones. For example, if there’s a significant concentration of buy orders at a specific price, that level might serve as a strong support if prices start to dip.
The depth of the order book plays a key role in how trades impact prices. A deep order book, with substantial volume at various price levels, can absorb trades without causing large price swings. On the other hand, a thin order book, with fewer orders, can lead to sharp price changes even with relatively small trades. Immediate price changes are influenced by the best bid and ask levels, while orders farther from these levels only come into play during larger market moves.
These patterns provide valuable insights for traders, helping them generate actionable signals and refine systematic trading strategies.
Reading Order Imbalances for Price Trends
Building on the understanding of order book dynamics, let’s explore how real-time imbalances can signal upcoming price movements.
Order flow imbalance (OFI) measures the difference between buy and sell order volumes at the best bid and ask prices. This metric is particularly effective for predicting short-term price changes. Unlike traditional volume-based models, which can be noisy, OFI provides a clearer and more reliable indication of imminent price trends.
Traders often monitor queue sizes in real time to identify these imbalances. For instance, a sudden drop in sell-side liquidity combined with an increase in buy orders can signal an impending price surge. During volatile trading sessions on the SGX, it’s been observed that when one side of the order book thins out while pressure builds on the other, prices can spike within seconds.
Comparing Order Book Trading Methods
Different trading methods based on the order book come with their own pros and cons.
| Method | Advantages | Disadvantages |
|---|---|---|
| Market Orders | Ensures immediate execution; guarantees trade completion | Higher costs due to slippage in thin markets; less control over price |
| Limit Orders | Allows precise control over price; can add liquidity to the market | Execution isn’t guaranteed; may miss out on rapid price movements |
| Order Book Analysis | Helps predict short-term price changes; improves trade timing | Requires access to real-time data and advanced analysis; can be complex |
Market orders are ideal when you need your trade executed immediately, especially if the order book has enough depth to absorb the trade without significant slippage. However, in thin markets or during volatile periods, market orders can lead to less favourable prices as they consume available liquidity at higher or lower levels.
Limit orders, on the other hand, give you control over the price at which your trade executes. They are particularly useful when you’ve identified strong support or resistance levels in the order book. However, there’s always a risk that the market won’t reach your specified price, leaving your order unfilled.
Order book analysis can help traders fine-tune their entry and exit points. Platforms like Collin Seow Trading Academy provide resources for developing trading systems that incorporate key order book metrics, such as OFI, market depth, and changes in spreads. These systems can automatically execute trades when certain thresholds, like liquidity imbalances or rapid shifts, are detected.
Another valuable tool is analysing the order book slope, which shows how liquidity builds away from the best bid and ask prices. A steep slope indicates that liquidity is concentrated near current prices, making the stock more prone to sharp moves. Conversely, a more gradual slope suggests distributed liquidity, leading to smoother price movements.
Master Systematic Trading with Collin Seow
Learn proven trading strategies, improve your market timing, and achieve financial success with our expert-led courses and resources.
sbb-itb-466c9b0
Using Order Book Data in Trading Systems
Adding Order Book Metrics to Trading Systems
When it comes to crafting effective trading systems, integrating key order book metrics can make all the difference. Metrics like Order Flow Imbalance (OFI), bid-ask spread, and market depth are essential tools that help traders predict price movements and manage risk. Together, they provide a clear picture of market conditions and potential price shifts.
Order Flow Imbalance (OFI) is a particularly powerful metric, measuring the net difference between buy and sell orders at the best bid and ask prices. Research shows that OFI is a strong indicator of short-term price changes, making it a go-to tool for algorithmic trading systems that operate on tight timeframes. To use OFI effectively, calculate the net difference between buy and sell orders at the best prices over short intervals. Consistently positive imbalances can trigger buy signals, a strategy frequently employed by high-frequency trading systems.
Market depth is another critical factor, showing the volume available at each price level. This helps traders gauge how much liquidity is present and assess the potential impact of their trades. Studies reveal that deeper order books tend to reduce price impact for the same order size. By analysing market depth, traders can adjust their position sizes based on current liquidity conditions.
Finally, monitoring the bid-ask spread offers insights into transaction costs and liquidity. For Singapore markets, highly liquid stocks often have spreads as tight as SGD 0.01, while less traded securities may see spreads of SGD 0.05 or more. Incorporating spread thresholds into your trading system can help you avoid trades when transaction costs are too high. These metrics lay the groundwork for the execution strategies discussed in the next section.
Trade Execution During Market Volatility
Volatile markets demand a more strategic approach to trade execution, especially when using real-time order book data. During periods of heightened market uncertainty, bid-ask spreads can widen by up to 50%, reflecting reduced liquidity. By leveraging order book data, traders can improve execution prices by an average of 0.5% during these conditions.
One key strategy is to use limit orders during volatility. These allow you to control execution prices and reduce slippage, especially when the order book shows shallow depth or wider spreads. For instance, large orders exceeding 5,000 shares can trigger price changes within as little as 50-200 milliseconds, so responding quickly to order book updates is crucial.
Pay attention to buy/sell order ratios during volatile periods. Ratios exceeding 2.0 often signal directional market moves. Adjust your position sizes based on these ratios and current market depth. If liquidity is low, consider breaking large orders into smaller chunks to minimise their market impact.
Set up real-time alerts for significant order book changes, such as rapid spread widening, sudden drops in depth, or extreme OFI levels. These alerts can signal upcoming price movements, giving you a chance to adjust your positions or exit trades before adverse moves occur.
For risk management, consider using stop-losses based on order book levels rather than just price levels. For example, if the order book shows weakening support or increasing selling pressure, these stop-losses can offer better protection against sudden price swings.
Learning Resources for Systematic Trading
Mastering order book integration requires both structured learning and hands-on practice. For Singapore-based traders, the Collin Seow Trading Academy offers a range of resources tailored to systematic trading strategies that incorporate order book dynamics.
The Market Timing 101 E-Course is a great starting point for newcomers, covering the basics of order book analysis and trade timing techniques. For more advanced traders, the Systematic Trading Profits programme delves into a 3-Phase Growth System, focusing on applying advanced order book metrics in live trading scenarios.
For those who prefer in-depth reading, ‘The Systematic Trader v.2’ book provides detailed methodologies for integrating OFI, market depth, and spread analysis into trading algorithms. With examples specifically geared towards Singapore markets, it’s particularly relevant for local traders.
Live webinars hosted by the academy are another valuable resource. These sessions demonstrate real-time order book analysis, showing how to spot liquidity zones, interpret OFI, and execute trades based on changing market depth. The interactive format allows participants to ask questions and get feedback on specific trading challenges.
Finally, the academy emphasises the importance of historical order book data analysis. Backtesting strategies using metrics like OFI, spread changes, and depth variations ensures they hold up under different market conditions. This approach helps traders refine their strategies for various market cycles and levels of volatility.
With access to mentorship and an alumni support network, traders can get ongoing guidance as they implement order book-based strategies. This community aspect is especially helpful for troubleshooting algorithm issues or adapting to shifts in market microstructure.
Key Points About Order Book Dynamics
Main Concepts Summary
The order book is essentially a live display of buy and sell orders, showing the quantities available at each price level.
One key aspect is the bid-ask spread, which reflects market liquidity and transaction costs. For highly liquid Singapore stocks, these spreads are typically narrow, while less active securities tend to have wider spreads.
Another critical concept is Order Flow Imbalance (OFI), which serves as a strong indicator of short-term price changes. Research shows that OFI at the best bid and ask levels accounts for about 65% of price movements. This metric captures the net difference between buy and sell orders, offering early clues about potential price shifts.
Market depth, on the other hand, refers to the volume of orders available at different price levels. It’s a useful tool for traders looking to assess how their trades might impact prices. For instance, studies involving 82 Nasdaq-listed stocks revealed a linear connection between cumulative liquidity and price impact – more liquidity leads to less price movement. This is especially relevant for large trades that could otherwise cause significant market disruptions.
Understanding these fundamentals helps traders adjust their strategies to suit shifting market conditions.
What This Means for Traders
Grasping these concepts can greatly improve your trading decisions and risk management. For instance, tracking order flow imbalances can provide early signals of price direction. Persistent buying at the best bid often pushes prices upward, while consistent selling typically signals a downturn.
Another important takeaway is the concave nature of the trade volume impact curve. Doubling the size of your trade won’t necessarily double its price impact. This insight is key for determining position sizes, especially when large trades could consume multiple levels in the order book.
Incorporating order book metrics into your trading strategy can help you avoid emotional decision-making. Recognising patterns, such as buy orders following buy orders and sell orders following sell orders, allows you to leverage predictable trends in order flow.
During volatile market conditions, bid-ask spreads often widen due to reduced liquidity. By using real-time order book data, traders can better time their entries and exits, aligning with the actual liquidity available at the moment.
These insights provide a strong foundation for traders to refine their strategies and adapt to market changes effectively.
Next Steps for New Traders
If you’re new to order book analysis, start by learning the basics – bids, asks, spreads, and depth – through demo accounts or simulation tools. This hands-on practice lets you observe market behaviour without risking your capital.
For Singapore traders, the Collin Seow Trading Academy offers valuable resources to help you dive deeper into systematic trading. Courses like the Market Timing 101 E-Course cover the essentials of order book analysis, while advanced programmes such as Systematic Trading Profits explore metrics like OFI and market depth.
To expand your knowledge further, the book The Systematic Trader v.2 provides detailed strategies for integrating order book dynamics into trading algorithms, with examples tailored specifically for Singapore markets. The academy’s live webinars are another great resource, demonstrating real-time analysis of liquidity zones and how to adjust your trades based on current market conditions.
FAQs
How can traders use Order Flow Imbalance (OFI) to anticipate short-term stock price movements?
Traders can use Order Flow Imbalance (OFI) to understand short-term stock price movements by examining the gap between buy and sell orders in the market. For instance, if buy orders significantly outnumber sell orders, it could suggest upward pressure on the stock price. On the other hand, a higher volume of sell orders might hint at a potential price drop.
By keeping a close eye on these imbalances in the order book, traders can pinpoint possible entry or exit opportunities. That said, relying solely on OFI isn’t enough. Pairing it with other trading strategies and solid risk management practices is essential to make smarter decisions and reduce potential losses.
What are some effective ways to reduce trading costs and slippage during volatile market conditions?
To keep trading costs in check and minimise slippage during volatile market conditions, it’s a good idea to use limit orders instead of market orders. With limit orders, you can set a specific price for your trade, helping you steer clear of sudden, unfavourable price swings.
Another tip is to trade during periods of higher liquidity – such as when major markets overlap or during regular trading hours. Higher liquidity generally means narrower bid-ask spreads, which makes it easier to execute trades at prices closer to what you want.
Also, resist the urge to overtrade when the market is turbulent. Instead, stick to systematic trading strategies that match your risk tolerance and long-term goals. If you’re looking to sharpen your skills, platforms like Collin Seow Trading Academy provide free courses and webinars designed to help traders handle tough market conditions with confidence.
What are liquidity shocks, and how do they influence bid-ask spreads and trading decisions?
Liquidity shocks happen when market liquidity changes abruptly and significantly, often triggered by unexpected events or large trades. When this occurs, the bid-ask spread tends to widen, making it costlier to buy or sell stocks. This can also lead to greater price volatility, adding another layer of complexity for traders.
To handle such situations, it’s important for traders to act cautiously and revisit their risk management plans. Using limit orders can help control transaction costs and prevent impulsive reactions to short-term price swings. Staying updated on market conditions and understanding how liquidity affects stock prices are key steps to making more calculated and informed trading decisions.