About the Security (HKEX: 700)
Tencent Holdings is a world-leading internet and technology company that develops innovative products and services, including video games, cloud computing, advertising, artificial intelligence (AI), and digital content. It operates instant messengers Tencent QQ and WeChat, along with the news site QQ.com.
Stock background:
The sharp rally in US technology stocks amid stretched valuations provides a reason to look the sector outside of US and closer to Asia. The uptrend in Tencent Holdings appears to be gaining steam as it attempts to catch up with its international peers.
The stock, which is still around 15% below its record high hit in 2021, rose to a four-year high after the company’s Q2 earnings beat estimates. The company reported revenue growth of 15% in the second quarter, boosted by strong gaming performance and AI-powered business expansion.
AI-led capital expenditures, which surged 119% in the second quarter, could help improve margins and return on investments, boosting long-term growth prospects for the company. AI-powered advertising to improve revenue, integration of AI across Tencent’s ecosystem improving efficiency, and a healthy pipeline of upcoming game releases (much anticipated Valorant Mobile) underscore the recent upward momentum in the stock.
Tencent Holdings (Weekly):
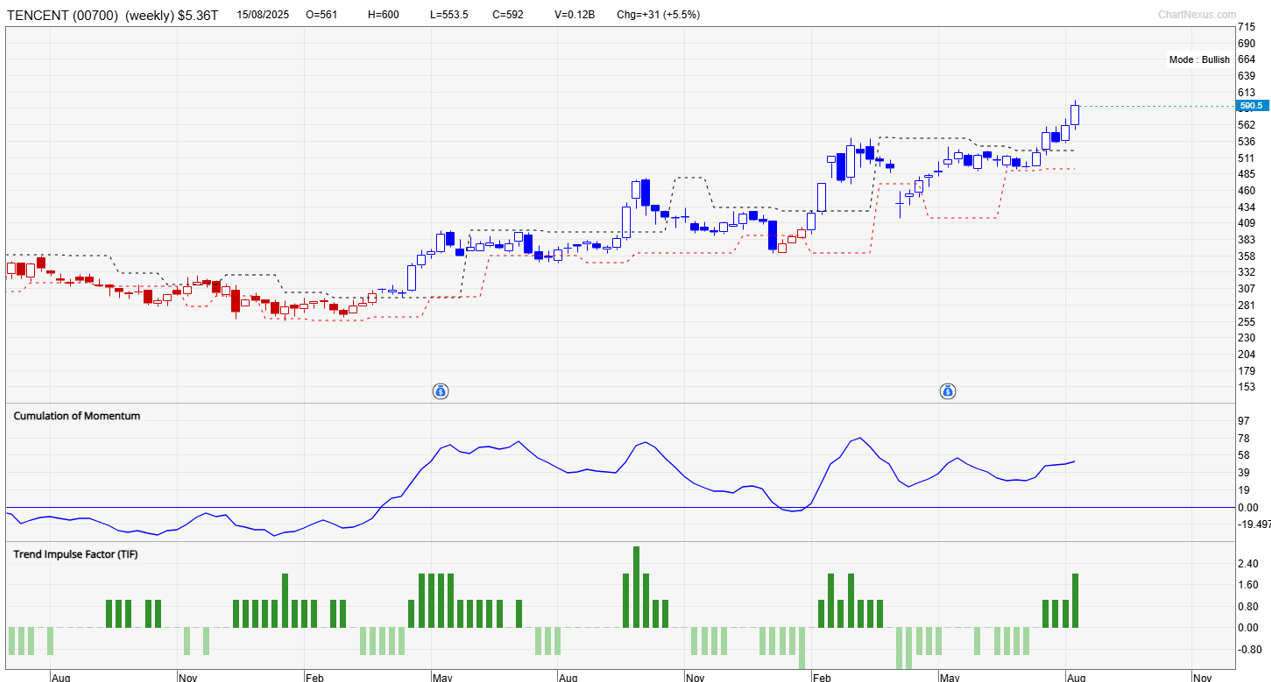
Technical Analysis on Tencent Holdings (HKSE: 700)
Our proprietary system TradersGPS (TGPS) turned Bullish on Tencent on the weekly charts in April 2024. As the chart above shows, the candle colours turned Blue from Red in February. As per our system, Blue candles indicate the stock’s trend is up. Red candles indicate the trend is down. While there were three Red candles at the start of this year, they were ‘unconfirmed’ bearish signals. As per our system, a Red candle should be followed by a lower low to confirm the downtrend. Similarly, a Blue candle should be followed by a higher high to confirm an uptrend. In effect, the system has been able to capture the uptrend since early last year.
Tencent Holdings (Weekly):
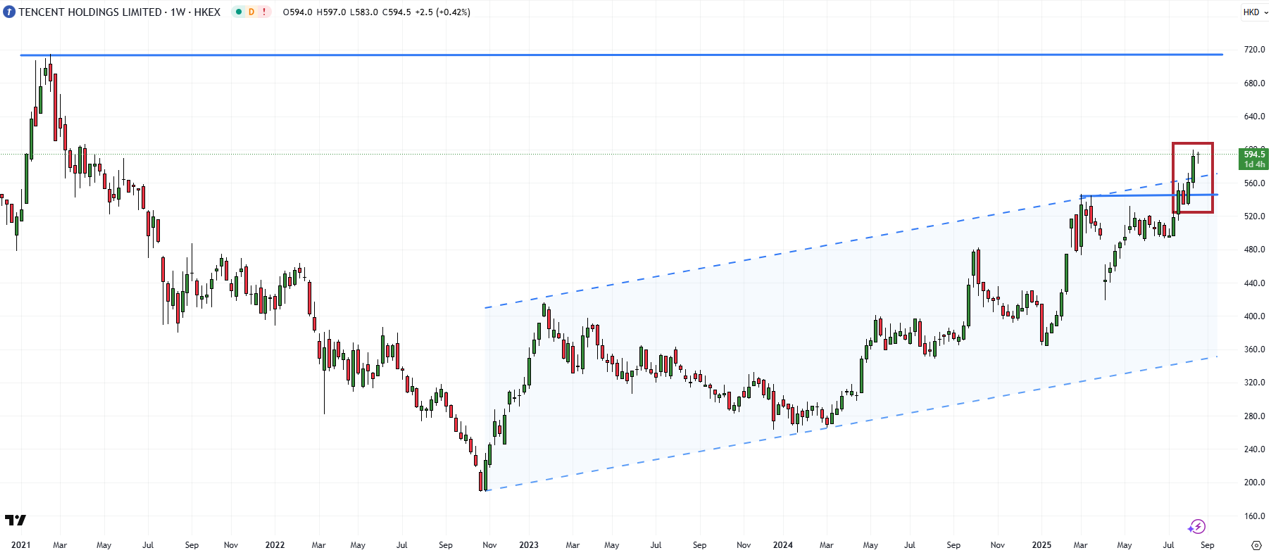
On technical charts, the break above key converged resistance – the March high of 547 and the upper edge of a rising channel from early 2023 (that came at 570) suggests the stock has embarked on the next leg higher. The lower edge of the channel is a rising trendline from October 2022 (now at about 350).
The bullish break has opened the way toward the 2021 high of 715. There is no significant resistance ahead of 715. On the downside, there is resistance-turned-support at 547. Subsequent support is at the June low of 490.