About the Security (NYSE: XLV)
State Street Health Care Select Sector SPDR ETF (XLV) seeks to track the investment results of the Health Care Select Sector Index.
The index includes companies from the pharmaceuticals, healthcare equipment and supplies, healthcare providers and services, biotechnology, life sciences, and US healthcare technology sectors.
Security background:
The US Healthcare sector has underperformed the broader S&P 500 index in recent years, as the XLV/S&P 500 ratio chart shows. Most recently, the healthcare ETF has started to reverse some of the underperformance.
The stark underperformance has been triggered by a mix of factors, including US policy uncertainty related to drug pricing and tariffs, and focus on strong earnings-driven IT, in particular, AI stocks.
XLV/S&P 500 Ratio (Daily):
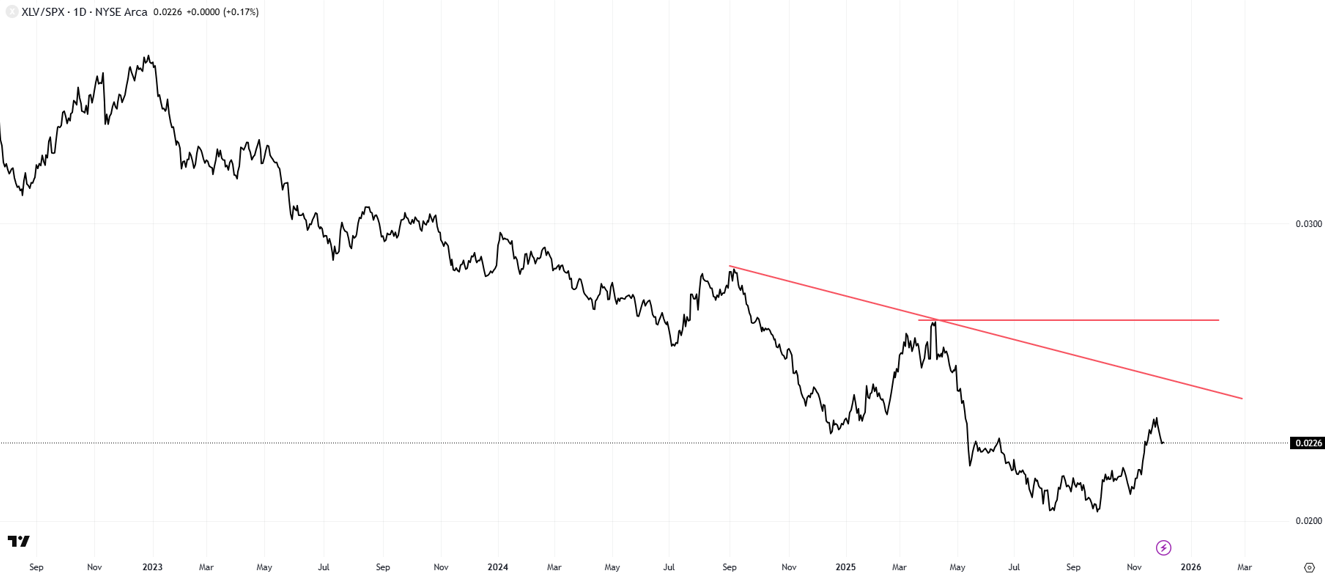
However, some of the policy-related uncertainty related to tariffs has started to fade, while mergers and acquisitions in the sector are injecting some optimism. Moreover, concerns about overvaluation in AI stocks have kept the rally in technology stocks in check, especially after a spectacular year-to-date performance.
To be fair, it would be too early to say whether the recent outperformance of healthcare stocks relative to the broader S&P 500 index is the start of a long-term reversal. However, on an absolute basis, XLV could have some more gains in store as price action suggests.
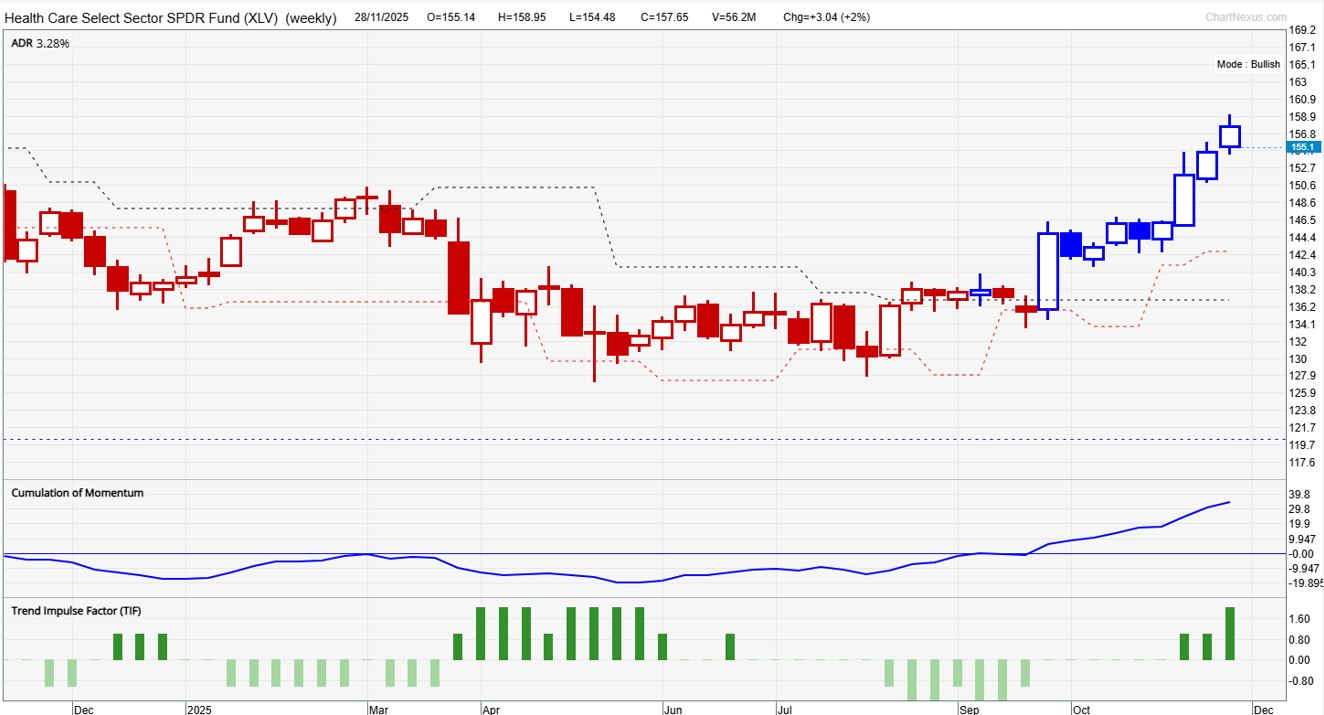
XLV (Weekly):
Technical Analysis on MSCI All Country Asia ex-Japan (NYSE: XLV)
Our proprietary system, TradersGPS (TGPS), turned decisively Bullish in October after the security broke above vital resistance at the June high of 137.75.
As per our system, Blue candles indicate the stock’s trend is up. Red candles indicate the trend is down. Since then, the candle colour has remained Blue.
What is also noteworthy is that signals on the weekly chart don’t change that often, making it suitable for investors with a multi-month time horizon. As seen from the chart, the candle colour turned Red around the end of 2024, in tandem with the downtrend.
XLV (Weekly):
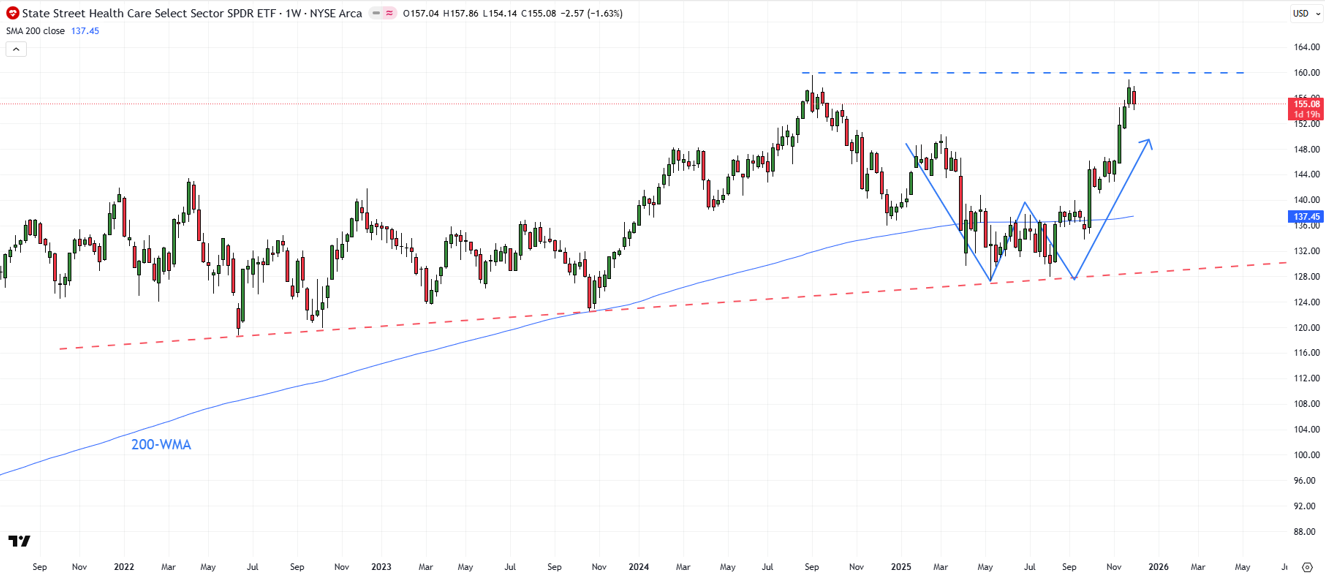
On the weekly candlestick charts, XLV’s break in October above crucial resistance at the October high of 137.75 triggered a double bottom pattern (the May and August lows), opening the potential toward 147.50. The ETF met the price objective of the pattern and is now testing another vital barrier at the 2004 high of 159.65.
Road Map: Breakout Above 159.65 vs. Supports at 151 / 141
The resistance at 159.65 is important, and a break above is by no means inevitable. But any break above would be bullish, triggering a breakout above a four-year choppy sideways range, paving the road toward the psychological 200-mark.
On the downside, there is immediate/minor support at the mid-November low of 151. Stronger support is at the mid-October low of 141. XLV would need to fall below 141 for the upside potential to fade.
FAQ
Why did US healthcare underperform, and why is it improving?
Policy uncertainty around tariffs and drug pricing, plus AI-led tech strength, weighed on healthcare. Fading tariff risk and sector M&A have improved sentiment.
What is the current technical signal for XLV?
TradersGPS turned Bullish in October on the weekly chart. Weekly signals tend to change less frequently, suiting multi-month investors.
What are the key levels to watch?
Resistance: 159.65 (a break could open a path toward the 200 area). Support: 151 (minor) and 141 (strong). A drop below 141 would fade the upside case.
Is the relative trend vs the S&P 500 turning?
The XLV/S&P 500 ratio has started to reverse some underperformance, signalling potential catch-up by healthcare.