The inability to extend Friday’s jump is another sign that the rally in US equity markets is looking tired, which is consistent with the market consolidation scenario highlighted about a month ago. For more details, see “US Equities: Headed for a Breather,” posted on July 16, 2025.
Equity markets spiked on Friday after Federal Reserve Chair Jerome Powell, in his annual address at the Jackson Hole symposium, opened the door for a September interest rate cut. Markets are pricing in around an 84% chance of a 25-basis-point cut at the mid-September Fed meeting, up from about 60% a month ago, according to the FedWatch tool.
The minutes of the July meeting released last week showed most Fed members agreed that it was too soon to reduce interest rates, given the state of the labour market and inflation. It appears that the weak US jobs report earlier this month possibly tipped the balance in favour of a rate cut for the Fed.
Having said that, beyond the September rate cut, the outlook for interest rates appears less certain. It is a matter of time before higher tariffs are eventually passed on to consumers, potentially hurting consumer confidence and spending.
“Regarding upside risks to inflation, participants pointed to the uncertain effects of tariffs and the possibility of inflation expectations becoming unanchored,” the Fed minutes said. Data released mid-August showed on an annual basis, producer or wholesale prices rose by the most since February, a sign of higher price pressures.
Furthermore, lingering uncertainty regarding tariffs, concerns regarding the independence of the Fed, and generally overbought conditions given the 30% rally since April suggest the bar to keep up the recent pace of gains is rather high.
S&P 500 Index (Weekly):
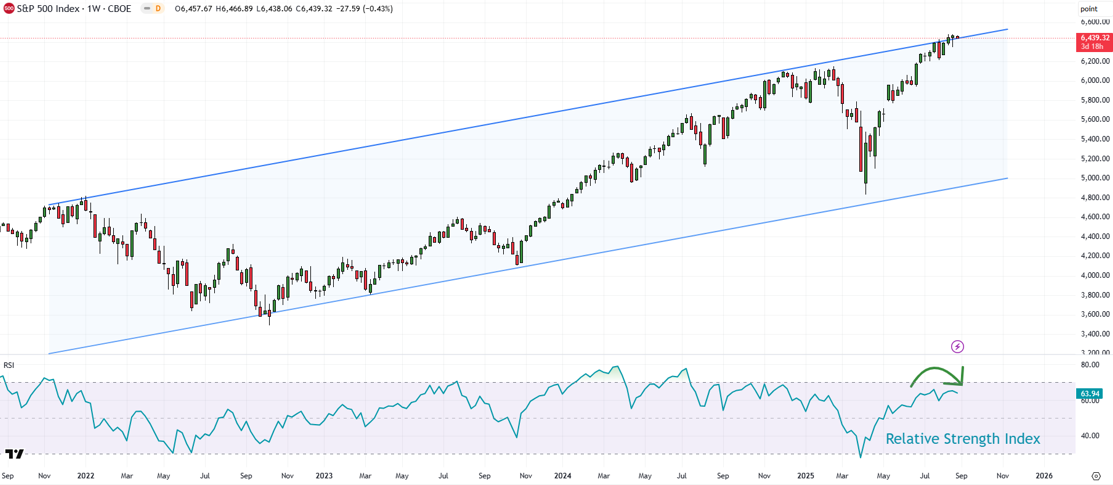
On technical charts, the S&P 500 index continues to struggle at vital resistance on the upper edge of a rising channel from the end of 2021. With the 14-week Relative Strength Index rolling over, it appears that the index hasn’t got enough momentum to clear the stiff resistance – at least in this attempt.
That is, the index may need to pause a bit before reattempting to clear the hurdle. The fact that the July-September quarter for US equities tends to be the worst compared to the other quarters raises the bar for an imminent break.
S&P 500 Index (Weekly):
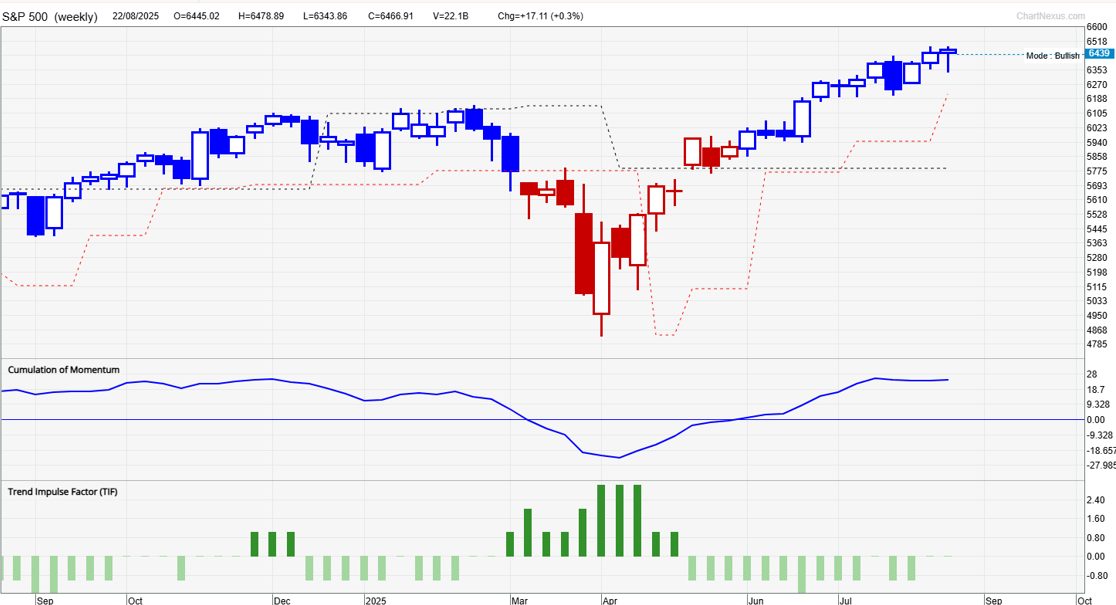
A key reason why it seems like a consolidation rather than a reversal of the uptrend is guidance from our proprietary system, TradersGPS (TGPS). One of the biggest advantages of having and following a system is that it removes any potential bias from the market assessment. Our system remains Bullish on the S&P 500 index on the daily and the weekly charts.
As per the system, Blue candles indicate the stock’s trend is up. Red candles indicate the trend is down. We would rather wait for the candle colour to turn Red on the weekly chart before turning bearish on the market.
S&P 500 (Daily):
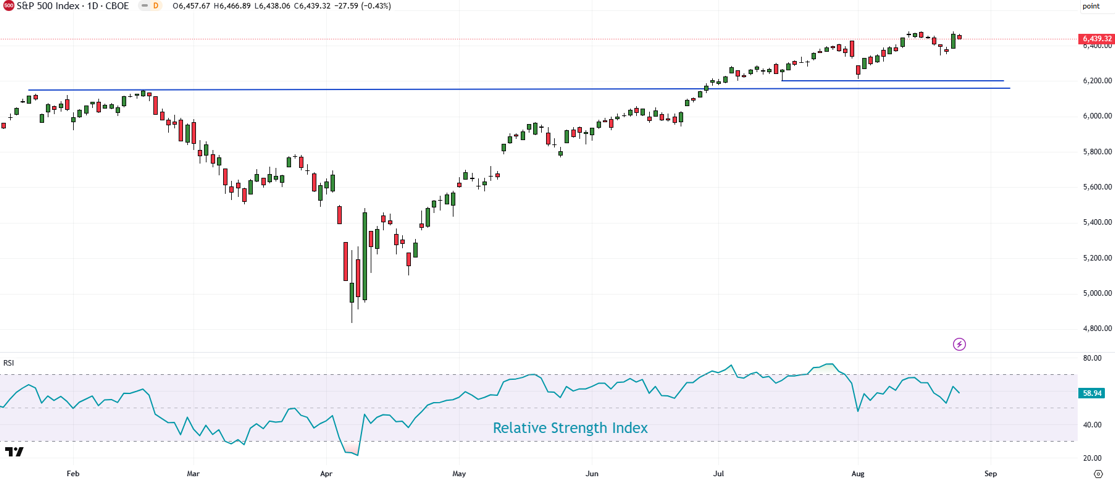
Moreover, the index hasn’t broken any significant support yet. Key support is at the mid-July low of 6200. A break below would confirm that the upward pressure had eased temporarily. Subsequent support is at the late-June low of 5950, followed by the late-May low of 5770. The index would need to fall below 5770 for the three-month-long uptrend to change.
On the upside, initial resistance is at the mid-August high of 6480, roughly around the upper edge of the rising channel. At a minimum, the index needs to clear last week’s high for the uptrend to resume.