US equities have been in a sweet spot with decent economic growth, loosening monetary policy, easing trade tensions, and robust earnings growth. The uncertainty of a December Federal Reserve interest rate cut reduces a key driver for markets going into the year-end, at least at the margin.
The US Federal Reserve cut its benchmark interest rate on Wednesday by a widely expected 25 basis points to 3.75%-4.0%. However, Federal Reserve Chair Jerome Powell cautioned against assuming that a December interest rate cut was a done deal. Odds of a December Fed rate cut have shrunk to around 67% from over 90% before Wednesday’s Federal Open Market Committee (FOMC) meeting.
What Changed Since the September FOMC?
At the September FOMC meeting, Fed officials had projected three more rate cuts in the coming months – two rate cuts this year (October and December) and one rate cut in 2026. As a result, markets were pricing in near certainty of two rate cuts this year. However, the shrinking of the odds for a December rate cut clouds the outlook on rates for not only this year but also next year.
That implies markets may have to deal with one less driver in the interim until there’s availability of key US economic data, which has been delayed by the government shutdown. However, there are enough drivers to ensure the uptrend remains intact.
Earnings Snapshot: S&P 500 Net Profit Margins
THE US Q3 earnings season has just kicked off, with companies reporting strong results. According to FactSet, this quarter marks the 6th consecutive quarter that the S&P 500 is reporting net profit margin (NPM) above the 5-year average. Moreover, analysts believe NPMs will be higher in 2026.
Optimism is running high as US President Donald Trump and China President Xi Jinping meet on the sidelines of the APEC summit in South Korea. The US president has threatened that new tariffs of up to 100% could take effect from November.
Geopolitical analysts don’t expect major breakthroughs, but continued dialogue and framework agreements could be enough to keep hopes of an eventual resolution in trade tensions.
S&P 500 (Weekly):
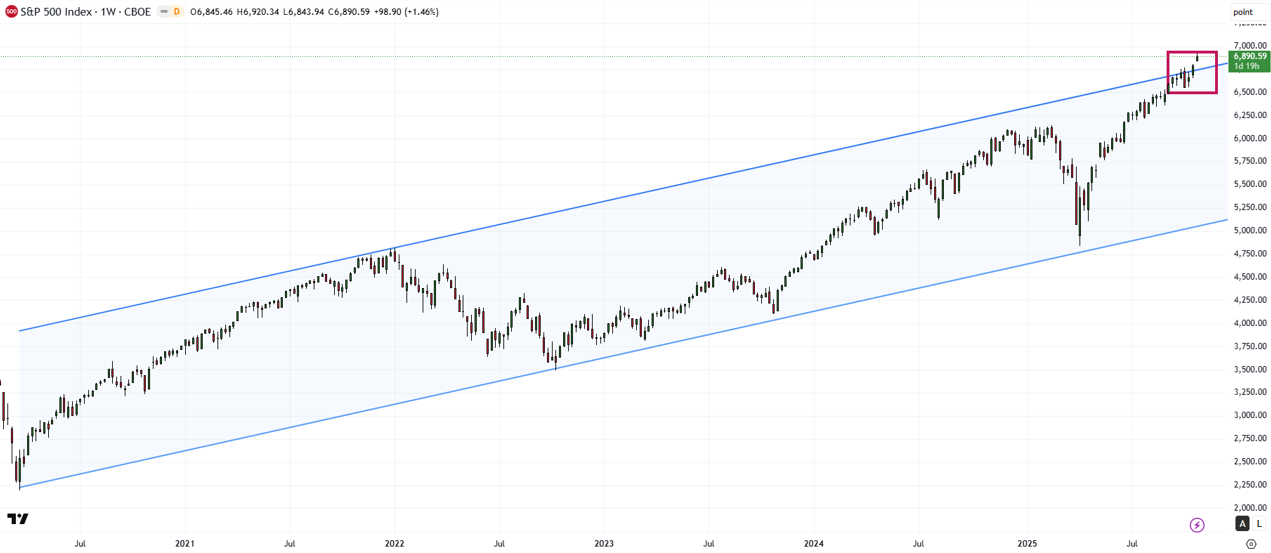
On technical charts, the S&P 500 index continues to post higher-highs-higher-lows – a sign that the uptrend is in place. It is now attempting to break resistance on the upper edge of a rising channel from the end of 2021. A bullish break could pave the way initially toward the psychological 7000 mark, potentially 7500 in the coming months.
S&P 500 Index (Weekly):
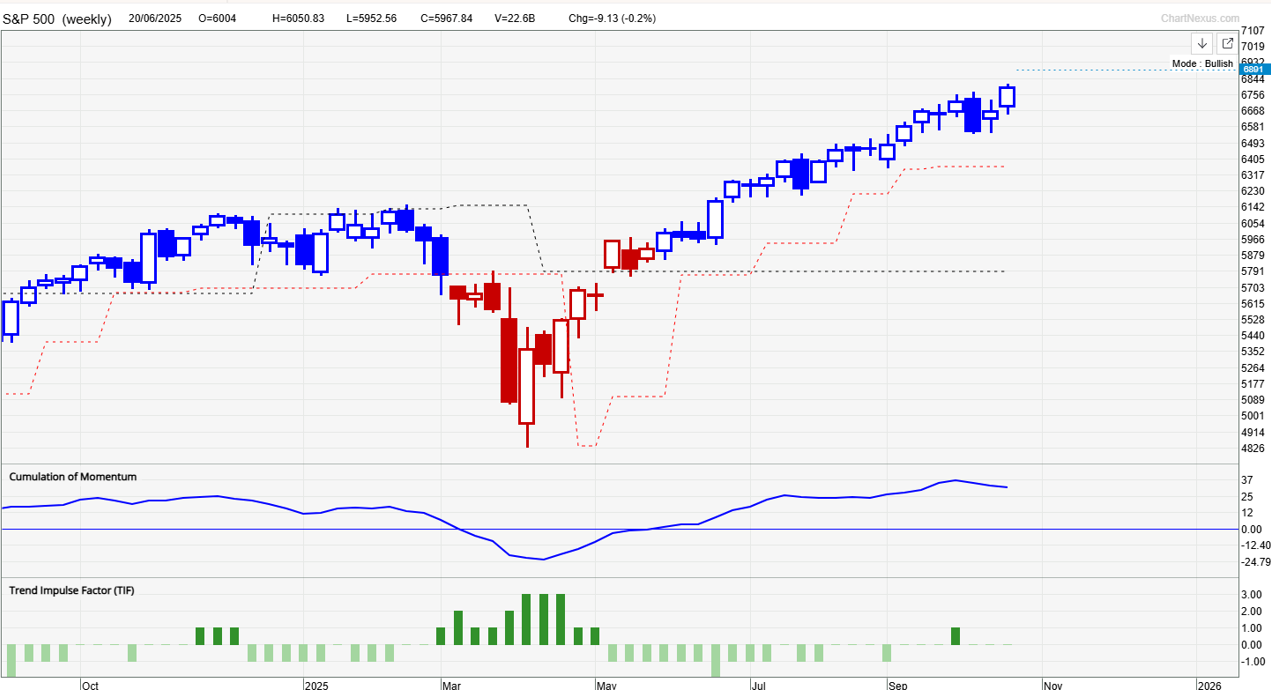
TradersGPS Signals (Mode: Bullish)
Our proprietary system TradersGPS (TGPS) remains Bullish on the S&P 500 index on the daily and the weekly charts. Blue coloured candles indicate the trend is Bullish; Red coloured candles indicate the trend is Bearish. In a sign that the uptrend is solidifying, the pace of the gains has increased in recent weeks.
On the downside, there is quite strong support at the early-October low of 6550. The index would need to fall below the support for the uptrend to fade.
FAQ
Did the Fed cut rates, and what’s the new target range?
The Federal Reserve cut its benchmark rate by 25 basis points to a target range of 3.75%–4.0%.
Is the S&P 500 weekly trend still bullish?
Yes. The index is in a higher-highs, higher-lows structure within a rising channel on the weekly chart.
What key technical levels are mentioned?
Watch resistance at the upper edge of the rising channel and support near the early-October low around 6,550.