If there’s one clear narrative for financial markets since the start of the year, then it is Tariffs.
The reciprocal tariffs announced by US President Donald Trump on April 2, and subsequent counter tariffs from China pushed the Nasdaq in bear market territory and raised fears of a global recession.
However, that seems to be reversing, at least for now. On Monday US and China agreed to cut tariffs at least for 90 days, bringing headline US tariffs on Chinese imports to 30% from 145%, and Chinese duties on US imports to 10% from 125%. Stocks markets cheered the announcement, safe-haven bids for gold disappeared, and the US dollar rebounded globally.
The US-UK trade deal struck last week, and potential US trade deals in the pipeline with India, South Korea, and Japan suggests the willingness of policymakers to come to the negotiation table. However, not many expected a swift base level agreement between the world’s two largest economies. The faster-than-expected agreement, even though temporary, was reflected in the reaction in global financial markets, reducing the odds of a global recession and a major slowdown in the Chinese economy.
SPX and NDX broke above key resistance with a gap and closed at intraday highs. VIX a measure of expected volatility on the SPX index options, is almost back to where it was before the reciprocal tariffs announcement on April 2. All else being the same, if the announcement of tariffs led to a major decline in risky asset markets, a retest of the year-to-date highs on a reversal/pause of the tariffs wouldn’t be surprising.
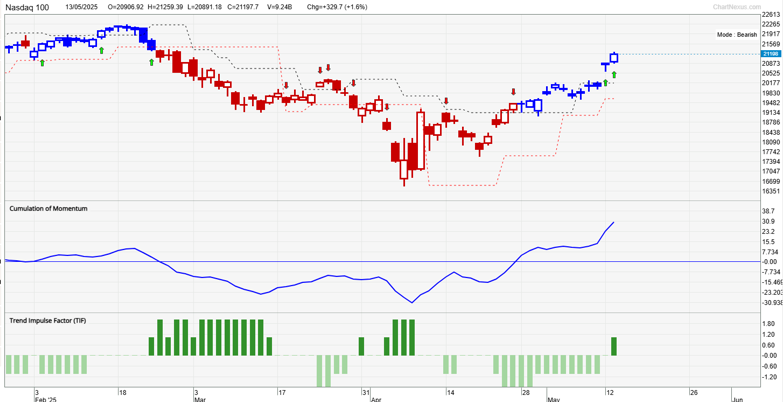
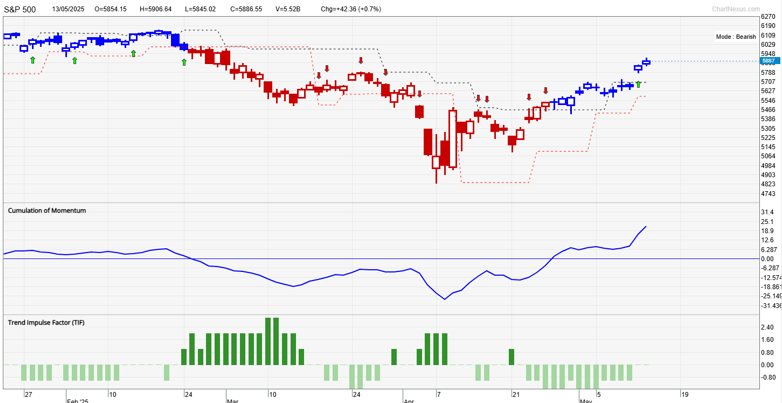
Our proprietary TradersGPS (TGPS) system highlighted a reversal of the downtrend toward the end of April. Notice the candle colours on the daily charts of the Nasdaq 100 and the S&P 500 Index changed to Blue from Red. A Red coloured candle has Bearish implications for the trend, that is, potential for further losses in the index; a Blue coloured candle implies a Bullish trend, that is, possibility of further gains.
For instance, in the Nasdaq 100 index, the colour of the candles changed to Red from Blue late February, flashing a red flag for the multi-month-long uptrend. The colour of the candles changed to Blue once again on April 28. While the system itself generates buy-sell signals from time to time, it also serves well for an objective assessment of the trend.
The S&P 500 and the Nasdaq 100 indexes’ break above crucial resistance with a gap on strong momentum has opened the way toward the February highs. That could be a tough barrier to crack. Much would depend on the progress and speed of further negotiations, especially if there is any back-tracking. In this regard, US Treasury Secretary Scott Bessent has acknowledged it will take years to reset Washington’s trade relationship with Beijing. For now, though, from financial markets’ perspective, “a reversal of bad news is good news”.