About the Company (NASDAQ: QCOM)
Qualcomm Incorporated creates semiconductors, software, and services related to wireless technology. The company’s dominance in 5G technology remains its key source of growth. It owns patents critical to 5G, 4G mobile communications standards.
Stock background:
Qualcomm has cemented its leadership in AI processing, high-performance, and low-power computing, enabling it to become the platform of choice as AI gains momentum. The company has invested heavily in AI across a range of devices from phones to automotives, including robotics.
The company kicked off its CES show at the beginning of the year by announcing a full suite of robotics technologies from small household robots to full-sized humanoids, according to CNET. Analysts estimate the diversification strategy could propel revenue growth in the years ahead.
Financial Strength, Guidance, and Dividend Appeal
Thanks to a strong free cash flow profile, the company has the ability to invest in profitable growth initiatives. In the fourth quarter and full-year earnings announced in November, the company gave guidance for record revenues for the first quarter of 2026.
From a valuation perspective, the stock is trading above its historical average, but is slightly cheaper compared with the US Semiconductor industry average. Qualcomm offers a 2% dividend yield, compared with Broadcom’s 0.7% and Intel’s 0.6%, according to TradingView.
Technical Analysis on Qualcomm Incorporated (NASDAQ: QCOM)
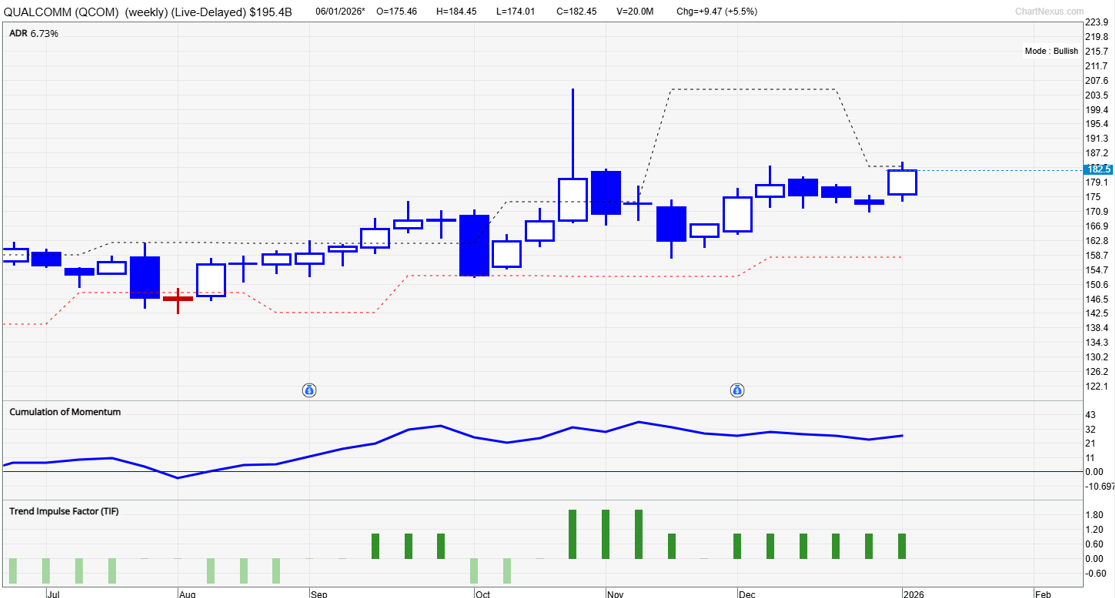
Blue candles on the weekly chart since mid-2025 show that our proprietary system, TradersGPS (TGPS), has been bullish. As per our system, Blue candles indicate the stock’s trend is up; Red candles indicate that the stock’s trend is down.
Gradually higher tops and higher lows are a sign that the trend is up, even as price gain has been slow in recent weeks.
Key Resistance & Upside Targets
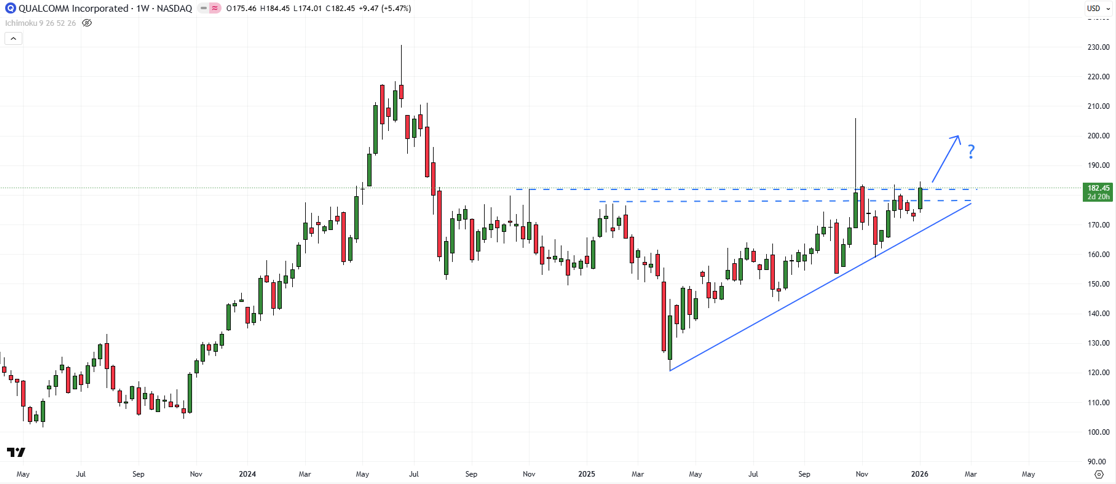
The recovery since early 2025 is at best “two steps forward, one step back”, albeit with a bullish bias reflected by the uptrend line.
After two failed attempts at the end of 2025 to break above 177-182 (the November 2024 and the February 2025 highs), the stock is once again testing the vital barrier. A break above could open the door toward the record high of 230 hit in June 2024. Blue candles on the weekly chart, as per TradersGPS, suggest the odds of a break above are rising.
Downside Risk & Support Levels
On the downside, only a break below support at the August low of 144 could pose a threat to the uptrend. Immediate support is at the mid-November low of 159, followed by the October low of 153.
FAQ
Why is Qualcomm considered a breakout candidate?
Qualcomm is testing a key resistance zone at 177–182 after forming higher tops and higher lows, while weekly TradersGPS signals remain bullish.
What are Qualcomm’s main growth drivers?
Leadership in 5G, expanding AI processing capabilities, diversification into automotive and robotics, and strong free cash flow underpin growth.
What upside levels are in focus?
A confirmed break above 177–182 could open the door toward the June 2024 record high near 230.
What downside levels should investors watch?
Immediate support lies near 159, followed by 153. A break below the August low around 144 would threaten the uptrend.