The PEG ratio, short for Price/Earnings-to-Growth ratio, is a tool that helps you evaluate whether a stock is priced fairly by factoring in its future growth potential. It builds on the P/E ratio (Price-to-Earnings) by adding a growth perspective, making it especially useful for comparing companies across industries.
Here’s the formula:
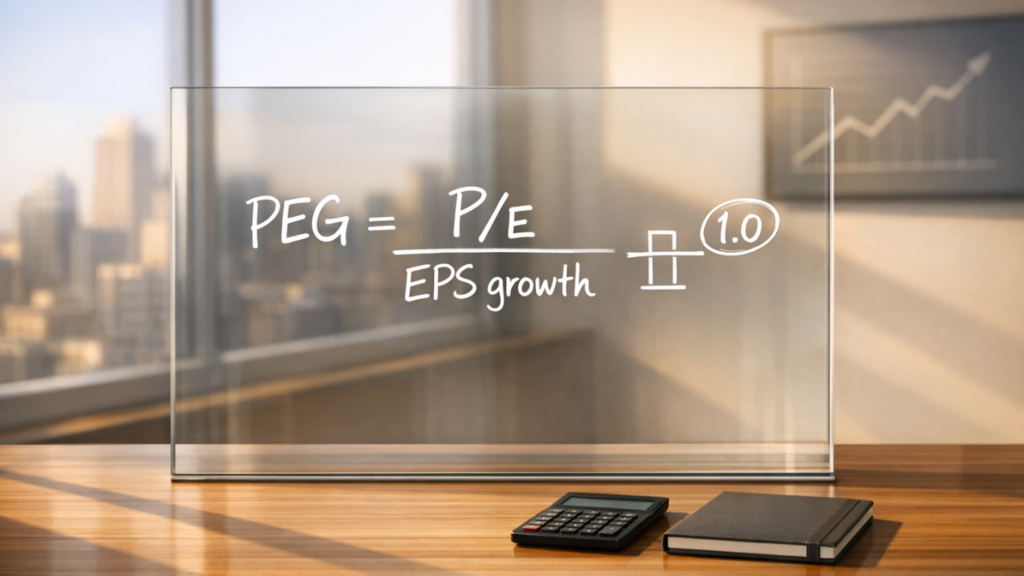
PEG = (P/E Ratio) ÷ Expected Annual EPS Growth Rate
- PEG below 1.0: The stock may be undervalued.
- PEG of 1.0: Indicates fair pricing – price aligns with growth.
- PEG above 1.0: Suggests overvaluation.
- Negative PEG: Signals losses or declining growth, requiring caution.
The PEG ratio is a practical way to spot growth stocks that might offer better value than their P/E ratio suggests. However, it relies heavily on growth forecasts, which can be uncertain. For a well-rounded analysis, combine the PEG ratio with other metrics like debt-to-equity or dividend yield.
How to Calculate the PEG Ratio
PEG Ratio Formula
Let’s break down how to calculate the PEG ratio step by step.
The formula is straightforward:
PEG = (P/E Ratio) ÷ Expected Annual EPS Growth Rate
Here’s how it works:
- The P/E ratio is simply the stock price divided by the earnings per share (EPS).
- The growth rate represents the anticipated percentage increase in EPS over a specific period, usually between 1 and 5 years. Always enter the growth rate as a whole number (e.g., use 15 for 15%).
You can find the necessary data – like stock price, EPS, and growth projections – on financial news platforms, through analyst reports, or by learning systematic trading strategies. Keep in mind:
- A forward PEG ratio uses forecasted growth rates.
- A trailing PEG ratio relies on historical growth data from the last 3 to 5 years.
Step-by-Step Calculation
Here’s how to calculate the PEG ratio in three simple steps:
- Step 1: Calculate the P/E ratio using either historical (trailing) or estimated (forward) EPS.
- Step 2: Obtain the projected EPS growth rate from a reliable source, ensuring the timeframe for growth is consistent.
- Step 3: Divide the P/E ratio by the growth rate (entered as a whole number) to arrive at the PEG ratio.
For accurate comparisons, always use data from the same source and timeframe, especially when evaluating multiple companies.
Comparison Table: How Growth Affects PEG
To see how growth rates influence the PEG ratio, take a look at the table below. It compares three hypothetical companies, all with the same P/E ratio but different growth rates. Notice how a higher growth rate drives the PEG ratio down, signalling better growth value.
| Company | P/E Ratio | Expected Annual Growth Rate | PEG Ratio | Valuation Signal |
|---|---|---|---|---|
| Company A | 20 | 10% | 2.0 | Overvalued |
| Company B | 20 | 20% | 1.0 | Fairly Valued |
| Company C | 20 | 30% | 0.67 | Undervalued |
In this scenario, all three companies share the same P/E ratio, but Company C stands out as the most appealing. Its higher growth rate results in a lower PEG ratio, showing that high-growth companies – even with elevated P/E ratios – can sometimes offer better value than slower-growing ones.
sbb-itb-466c9b0
How to Interpret PEG Ratio Values
Once you’ve calculated the PEG ratio, the next step is understanding what the numbers mean to assess a stock’s valuation.
Understanding PEG Ratio Ranges
The PEG ratio gives you a quick sense of whether a stock is priced appropriately compared to its growth potential. Here’s how to interpret different ranges:
- PEG below 1.0: This suggests the stock might be undervalued, meaning you’re paying less for each unit of earnings growth. This situation often arises when market estimates are overly conservative.
- PEG of 1.0: A ratio of 1.0 indicates fair valuation. As Peter Lynch famously explained:
“A company’s P/E and expected growth should be equal, which denotes a fairly valued company and supports a PEG ratio of 1.0”.
At this level, the stock price aligns well with its projected earnings growth. - PEG above 1.0: A value higher than 1.0 points to overvaluation, where the stock price exceeds its growth expectations. This often happens when market hype drives prices beyond consensus forecasts. For example, Tesla (TSLA) had a PEG ratio of 2.04 as of 25 September 2024, which many would consider overvalued by standard metrics.
- PEG above 2.0: A ratio exceeding 2.0 is generally seen as a strong indicator of significant overvaluation.
- Negative PEG: This reflects losses or declining growth and signals high risk. Such stocks require extra scrutiny before investing.
By understanding these benchmarks, you can compare PEG ratios to evaluate a stock’s relative value.
Comparing PEG Ratios Between Stocks
The PEG ratio’s ability to factor in growth makes it a powerful tool for comparing stocks across industries. Unlike the P/E ratio, which can make high-growth sectors seem expensive, the PEG ratio adjusts for growth, offering a clearer picture.
For instance, a tech company with a P/E of 30 and 25% growth (PEG 1.2) might be a better deal than a utility company with a P/E of 15 and just 3% growth (PEG 5.0). Similarly, comparing a biotech stock with a P/E of 35 and 25% growth (PEG 1.4) to an oil company with a P/E of 16 and 15% growth (PEG 1.07) can help you identify the better value.
It’s also helpful to compare a stock’s PEG ratio to broader market benchmarks like the S&P 500. If the S&P 500 has a PEG of 1.33, a stock with a PEG of 1.2 might stand out as more attractive.
For stocks that pay high dividends, such as utilities, the standard PEG ratio might not tell the full story. In these cases, adjusting the growth rate to include the dividend yield (yield-adjusted PEG) can provide a more accurate valuation. Additionally, check whether you’re using a forward PEG (based on analyst forecasts) or a trailing PEG (based on historical data), as the results can differ significantly.
Pros and Cons of the PEG Ratio
The PEG ratio, like any valuation tool, comes with its own strengths and weaknesses. Knowing these details can help you decide when it’s a good fit for your analysis and when to pair it with other metrics.
Benefits of Using the PEG Ratio
One of the biggest advantages of the PEG ratio is that it factors in future earnings growth. This means it adjusts current valuations by considering expected earnings increases. This approach can stop you from dismissing high-growth companies that might seem overpriced if you only look at their P/E ratio.
Another plus? It works across industries. As Investopedia points out:
“The PEG ratio’s real strength lies in its ability to normalise comparisons across different industries”.
This makes it particularly handy for spotting growth stocks that might be undervalued. While these benefits are compelling, it’s equally important to understand where the PEG ratio falls short.
Drawbacks to Consider
The PEG ratio has a major downside: it hinges on growth estimates, which are often uncertain or overly optimistic. Analysts may also use varying timeframes – one year, three years, or even five years – when projecting growth, which can lead to inconsistencies.
Additionally, the ratio simplifies valuation by ignoring critical factors like a company’s debt load, cash flow, and return on equity. It also doesn’t account for dividend income, making it less effective for evaluating mature, dividend-heavy firms like utilities. Temporary growth spikes can further skew the ratio, leading to potentially misleading conclusions.
Here’s a quick comparison of the PEG ratio and the P/E ratio to break it down further:
Comparison Table: PEG vs P/E Ratio
| Category | P/E Ratio | PEG Ratio |
|---|---|---|
| Metric | Price ÷ Earnings Per Share (EPS) | P/E Ratio ÷ Annual EPS Growth Rate |
| Benefits | Simple to calculate; reflects current profits | Adjusts for future growth; works across industries |
| Drawbacks | Ignores growth, debt, and cash flow | Relies on growth estimates; ignores dividends and debt |
| Ideal For | Mature, stable companies with predictable earnings | High-growth sectors like tech or biotech |
Understanding these nuances can help you refine your investment strategy, especially when using the PEG ratio alongside other metrics.
Using the PEG Ratio in Systematic Trading
Finding Undervalued Growth Stocks
The PEG ratio is a useful tool for identifying undervalued growth stocks. A good starting point is to screen for stocks with a PEG ratio below 1.0. This can indicate that the market might be underestimating the company’s growth potential. A PEG ratio of 1.0 signifies fair value, where a stock’s price aligns with its expected earnings growth.
Forward PEG ratios, which consider projected earnings growth over the next one to five years, are particularly relevant for systematic trading strategies. They provide a forward-looking perspective that aligns well with trading methodologies.
It’s also helpful to apply industry-specific benchmarks. For instance, Microsoft once had a PEG ratio of 1.4, making it an attractive option compared to the software industry’s median PEG of 1.9.
After identifying potential stocks, you can refine your analysis by combining the PEG ratio with other financial metrics.
Combining PEG with Other Metrics
The PEG ratio becomes even more powerful when paired with additional metrics like the price-to-book (P/B) ratio, debt-to-equity ratio, and free cash flow. These combinations help confirm whether a stock is undervalued or if its valuation is based on overly optimistic growth projections.
For companies that pay dividends, the dividend-adjusted PEG formula (P/E ratio ÷ [Earnings Growth Rate + Dividend Yield]) offers a more accurate valuation. This adjustment ensures that dividend-paying stocks aren’t misjudged as overvalued and can highlight their attractiveness as income-generating investments.
Here’s how some metric combinations can enhance systematic trading:
| Metric Combination | Purpose in Systematic Trading |
|---|---|
| PEG + P/B Ratio | Confirms if undervaluation is genuine or overly optimistic |
| PEG + Debt-to-Equity | Checks for hidden risks related to excessive debt |
| PEG + Dividend Yield | Adjusts valuation for dividend-paying companies |
| PEG + Industry Median | Offers context for sector-relative valuation |
These combinations provide a well-rounded view of a stock’s valuation and risk profile, forming a strong foundation for systematic trading.
PEG Ratio in Systematic Trading Methods
In systematic trading, the PEG ratio can reduce emotional biases by serving as a clear, rule-based filter. A common strategy is to start with P/E ratios to identify reasonably priced sectors, then narrow down to companies with strong growth potential using the PEG ratio.
At Collin Seow Trading Academy, traders integrate the PEG ratio with technical analysis to identify “Value on the Move” stocks. These are undervalued stocks that the market is beginning to notice.
For best results, keep your data sources consistent and ensure uniformity in P/E types and growth timeframes during your analysis. It’s also important to set clear rules for your approach. Companies with cyclical or volatile earnings may need a lower PEG threshold to account for the higher risk and ensure a sufficient margin of safety.
Master Systematic Trading with Collin Seow
Learn proven trading strategies, improve your market timing, and achieve financial success with our expert-led courses and resources.
Conclusion
Key Takeaways
The PEG ratio refines the traditional P/E analysis by factoring in expected earnings growth, offering a broader perspective on stock valuation. A PEG close to 1.0 typically signals fair value, while a figure below 1.0 may point to undervaluation.
One of the standout benefits of the PEG ratio is its ability to compare companies across different industries on an equal footing. This makes it particularly useful for systematic traders evaluating multiple sectors.
It’s crucial to verify growth estimates and be clear whether you’re using forward or trailing PEG, as forecasts can sometimes be overly optimistic. For the best results, pair the PEG ratio with other metrics like debt-to-equity ratios, free cash flow, and price-to-book ratios to ensure the growth is sustainable.
By applying the PEG ratio thoughtfully, you can improve your trading decisions and gain a deeper understanding of stock value.
Final Thoughts
These takeaways provide a foundation for integrating the PEG ratio into your trading strategy. As a tool, it helps pinpoint growth stocks at reasonable prices, making it an asset in systematic trading approaches. Start by screening sectors with appealing P/E ratios, then use the PEG ratio to zero in on companies with strong growth potential. For dividend-paying stocks, you might tweak the formula by adding the dividend yield to the growth rate to minimise overvaluation risks.
That said, the PEG ratio doesn’t account for factors like cash reserves, debt levels, or cyclical earnings. It’s best used as part of a broader strategy that combines multiple metrics. When applied consistently with reliable data and standardised timeframes, the PEG ratio can help uncover undervalued growth opportunities both in Singapore and globally.
For more on systematic trading strategies, check out the resources at Collin Seow Trading Academy.
FAQs
What is the difference between the PEG ratio and the P/E ratio?
The PEG ratio builds upon the P/E ratio by including a company’s earnings growth rate, providing a broader perspective on its value. While the P/E ratio simply compares a stock’s price to its current earnings, the PEG ratio takes it a step further by dividing the P/E ratio by the expected earnings growth rate. This added layer makes the PEG ratio especially helpful when assessing growth stocks, as it considers both their present valuation and their future growth prospects.
Why should both forward and trailing PEG ratios be considered when evaluating a stock?
Understanding both forward and trailing PEG ratios gives a clearer picture of a stock’s valuation. The forward PEG ratio considers expected future earnings growth, offering a glimpse into the stock’s potential. On the other hand, the trailing PEG ratio looks at past earnings growth, reflecting historical performance.
By examining both, investors can evaluate whether a stock might be priced too high or too low, aiding in making smarter choices when spotting market opportunities.
What are the drawbacks of using the PEG ratio alone to evaluate stocks?
The PEG ratio is a handy tool for assessing a stock’s value in relation to its growth potential, but it’s not without its flaws. One major drawback is its reliance on accurate and consistent growth rate predictions, which can easily be thrown off by market volatility or unexpected changes in a company’s performance.
Another issue is that the PEG ratio can oversimplify stock evaluation. By focusing mainly on growth and valuation, it often overlooks other key aspects like overall market conditions, industry shifts, and a company’s underlying fundamentals.
For companies with inconsistent earnings growth or limited profitability, the PEG ratio can sometimes paint a misleading picture. Because of these limitations, it’s wise to use the PEG ratio alongside other financial metrics and a thorough analysis of both the stock and its broader market environment.