After a multi-week lackluster trend, characterized by a narrowing volatility, gold has hit fresh record highs, thanks to expectations of lower interest rates, weakness in global US dollar, and continued structural demand for the yellow metal.
Spot gold (XAU/USD) rose nearly 35% from December 2024 to April 2025, marking one of the sharpest rallies in recent years. Overcrowded and extreme optimism following a cooling in trade tensions triggered a consolidation subsequently.
Despite the pause, gold did not break any meaningful support – a sign that the uptrend remained intact. Indeed, the minor retreat was quite shallow compared to the magnitude of gains since the beginning of the year. This is perhaps a reflection of the strong undercurrent that is holding gold at lower levels.
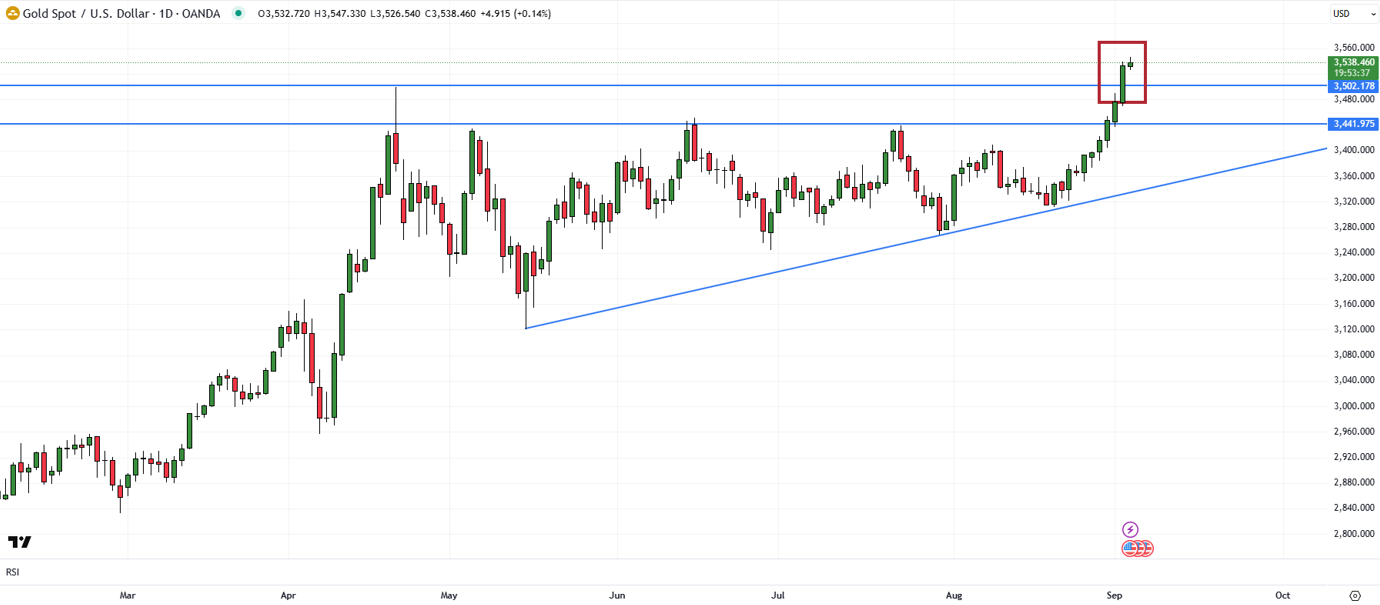
Spot Gold (XAUUSD; Daily):
According to the World Gold Council, overall gold demand in the US fell 34% on-quarter in Q2-2025. However, from a year-on-year perspective, demand actually rose more than 100% led by strong ETF demand.
Investor demand for gold has been resilient amid expectations of softer interest and the global US dollar weakness. The US Federal Reserve Chair Jerome Powell at the Jackson Hole symposium opened the door for a rate cut later this month. The market is pricing in a 90% chance of a 25bps rate cut at the September 17 Federal Open Market Committee (FOMC) meeting, and around 50% chance of another cut in December, according to the FedWatch tool.
Aside from investors’ demand for the yellow metal, steady central bank buying has been a key feature in recent years. Diversification of central banks’ reserves into gold has steadily increased over the years.
On short-term technical charts, gold has broken out of a symmetrical triangle. The lower edge of the triangle is an uptrend from mid-May; the upper edge of the triangle is a downtrend line from April. The break above the upper edge of the triangle has triggered a breakout from the continuation pattern, pointing to a potential rise initially toward the upper edge of a rising channel from 2023, possibly toward 3750.
Spot Gold (XAUUSD; Weekly)
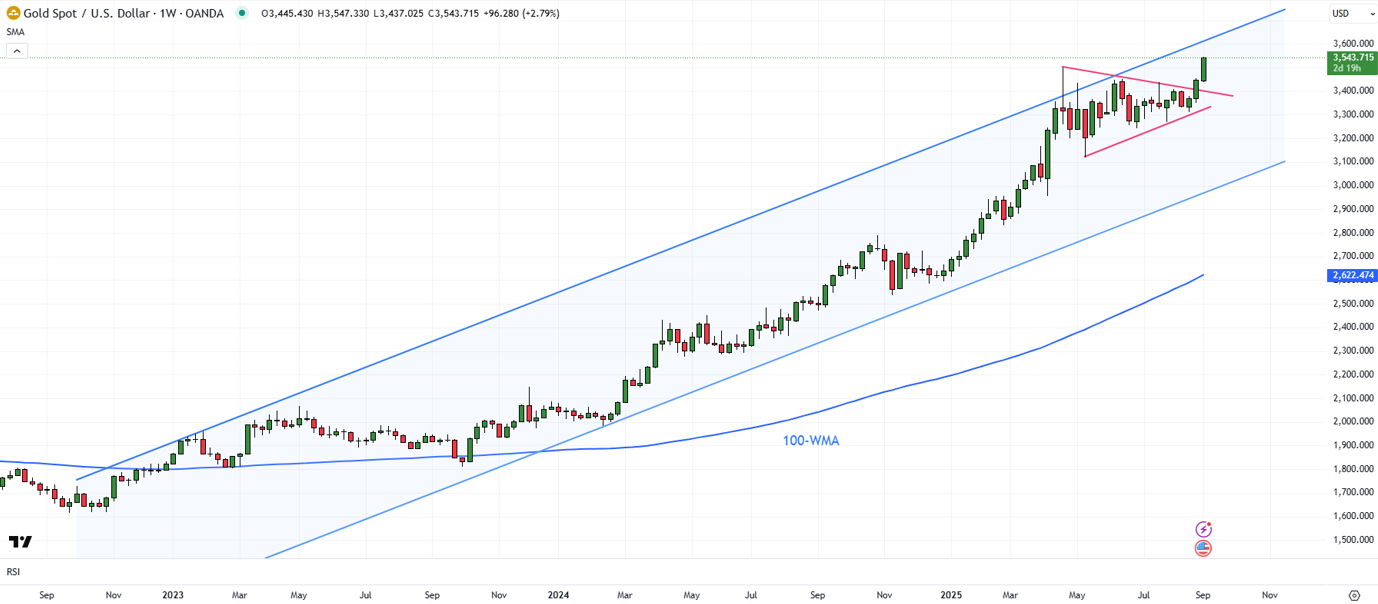
On longer-term charts, Gold has cruised in a gradually upward-sloping channel. The lower edge of the channel is an uptrend line from 2023. The upper edge of the channel is a rising trendline from 2024. Moreover, gold remains well above long-term moving averages, including the 100-week and the 200-week moving averages, suggesting the broader trajectory remains up.
On the downside, immediate support is 3425-3450. Stronger support is at the May low of 3120. Only a break below 3120 would imply that the upward pressure had faded somewhat.