About the Security (NASDAQ: CSCO)
Cisco Systems, Inc. is an American multinational digital communications technology company headquartered in San Jose, California. Cisco develops, manufactures, and sells networking hardware, software, telecommunications equipment, and other high-technology services and products.
Stock background:
Cisco Systems shares (CSCO) got a boost in November after the company reported better-than-expected fiscal first-quarter earnings and issued guidance that beat estimates. The earnings announced last month marked the fourth consecutive quarter of growth, reversing year-on-year revenue declines.
AI Infrastructure Tailwind: Hyperscaler Orders ~US$1.3B
Robust demand for Cisco’s products in developing AI infrastructure has been a key ingredient. The company said AI infrastructure orders from “hypercaler customers” reached $1.3 billion, “reflecting a significant acceleration in growth.”
The company has had strategic alliances with most major technology companies globally in areas such as AI, cloud, and cybersecurity. As the AI-driven infrastructure swing gains momentum, Cisco Systems could be a key beneficiary.
CSCO (Weekly):

Technical Analysis on Cisco Systems (NASDAQ: CSCO)
Our proprietary system, TradersGPS (TGPS), has been Bullish on Cisco Systems since late 2024. As per our system, Blue candles indicate that the trend is up, while Red candles indicate that the trend is down.
Signals appearing on the weekly charts have multi-week/multi-month investment implications, typically suiting those investors with a longer time horizon.
Notwithstanding a couple of Red candles in April this year, the colour of the candles has been largely Blue. The Red candles that appeared in April were due to rounding errors, and not a reflection of trend reversal.
That is because the Cumulation of Momentum indicator (a measure of the trend) has been essentially above 0, signifying an uptrend.
CSCO (Monthly):
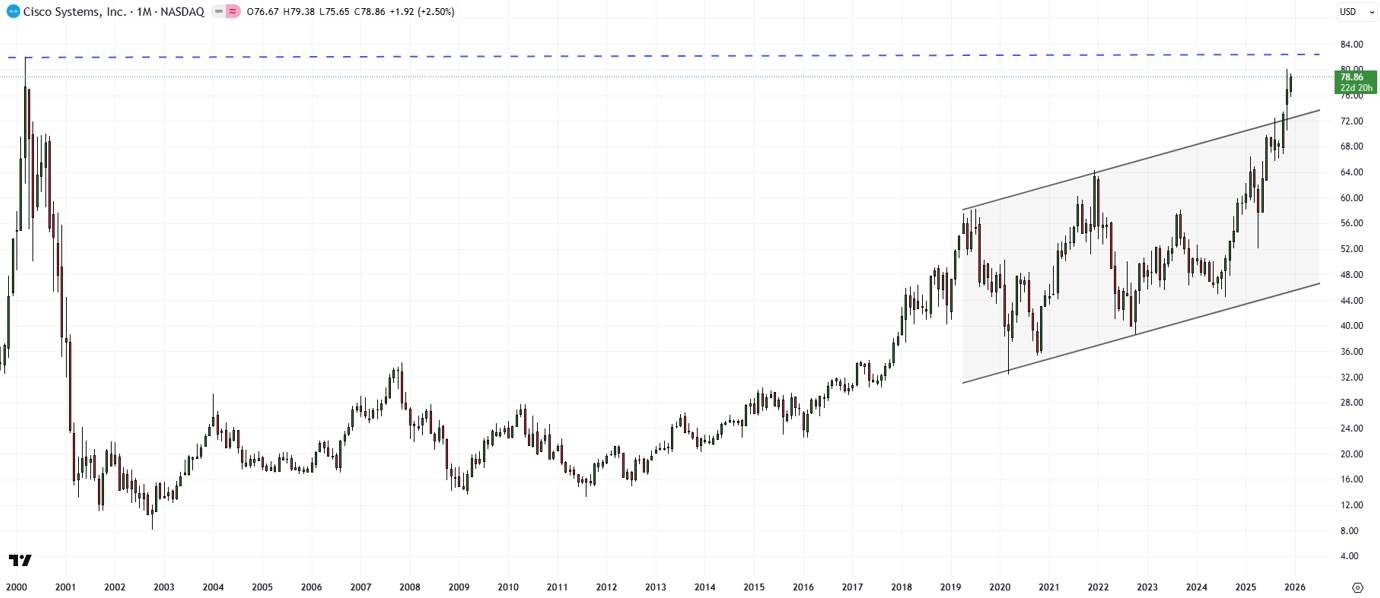
Breakout From Post-Covid Channel: Targets 82 → 100
After remaining in a slightly upward-sloping channel since COVID-19, Cisco Systems finally broke above the range recently. The lower edge of the channel is a rising uptrend line from 2020 (that is currently around 45), while the upper edge of the channel is a rising uptrend line from 2019 (currently around 72).
A breakout from any technical pattern has the tendency to lead to greater momentum in the direction of the breakout. CSCO’s break higher has put the focus on the 2000 record high of 82.
However, the resistance may not be enough to derail CSCO’s uptrend. Indeed, any break above 82 could pave the way toward the psychological 100 in the coming months/years based on the price objective of the rising channel.
On the downside, CSCO needs to hold above the November low of 70 for the short-term uptrend to remain in force.
FAQ
Why did Cisco’s share price jump recently?
Better-than-expected fiscal Q1 results and guidance, plus a fourth straight quarter of growth, lifted sentiment.
How big is the AI infrastructure boost?
Cisco reported about US$1.3B in AI infrastructure orders from hyperscaler customers, alongside broad alliances in AI, cloud, and cybersecurity.
What does the TradersGPS signal show?
Weekly TGPS has been Bullish since late 2024. Blue candles mark an uptrend; brief red candles in April were rounding effects with momentum still above zero.
Which levels should I watch?
Upside focus is the 2000 record high near 82; a clear break opens the psychological 100 objective. On the downside, holding ~70 preserves the short-term uptrend.