
China equities may have had a slow and steady ascent this year, but the world’s second-largest economy’s benchmark index is showing promise as we head into 2026.
The iShares MSCI China ETF (MCHI) is up 35% year to date, compared with the MSCI All Country World index roughly 15% during the same period.
Macro Backdrop: Valuations, Growth Softness, and Property Weakness
Easing trade tensions and attractive valuations have underpinned market sentiment amid sluggish economic growth and persistent weakness in the housing sector.
Recent macro data, including manufacturing and non-manufacturing activity, have reflected the softness in domestic demand, suggesting the economy may have slowed in the final quarter of 2025.
Policy Catalyst: Central Economic Work Conference and Potential Stimulus
The annual Central Economic Work Conference, likely this week, is due to discuss policy plans for next year. In particular, some participants expect additional stimulus to be announced, which could boost the sentiment in equities.
Aside from stimulus, market participants would be watching for measures toward the property sector, supporting domestic demand and business confidence.
Earnings & AI: Double-Digit Growth Expectations for 2026
Corporate earnings have been strong, with expectations of double-digit growth in earnings next year. Greater government policy support, coupled with continued corporate investments in AI, could be instrumental in pushing Chinese equities higher next year.
iShares MSCI China ETF (MCHI; Weekly):
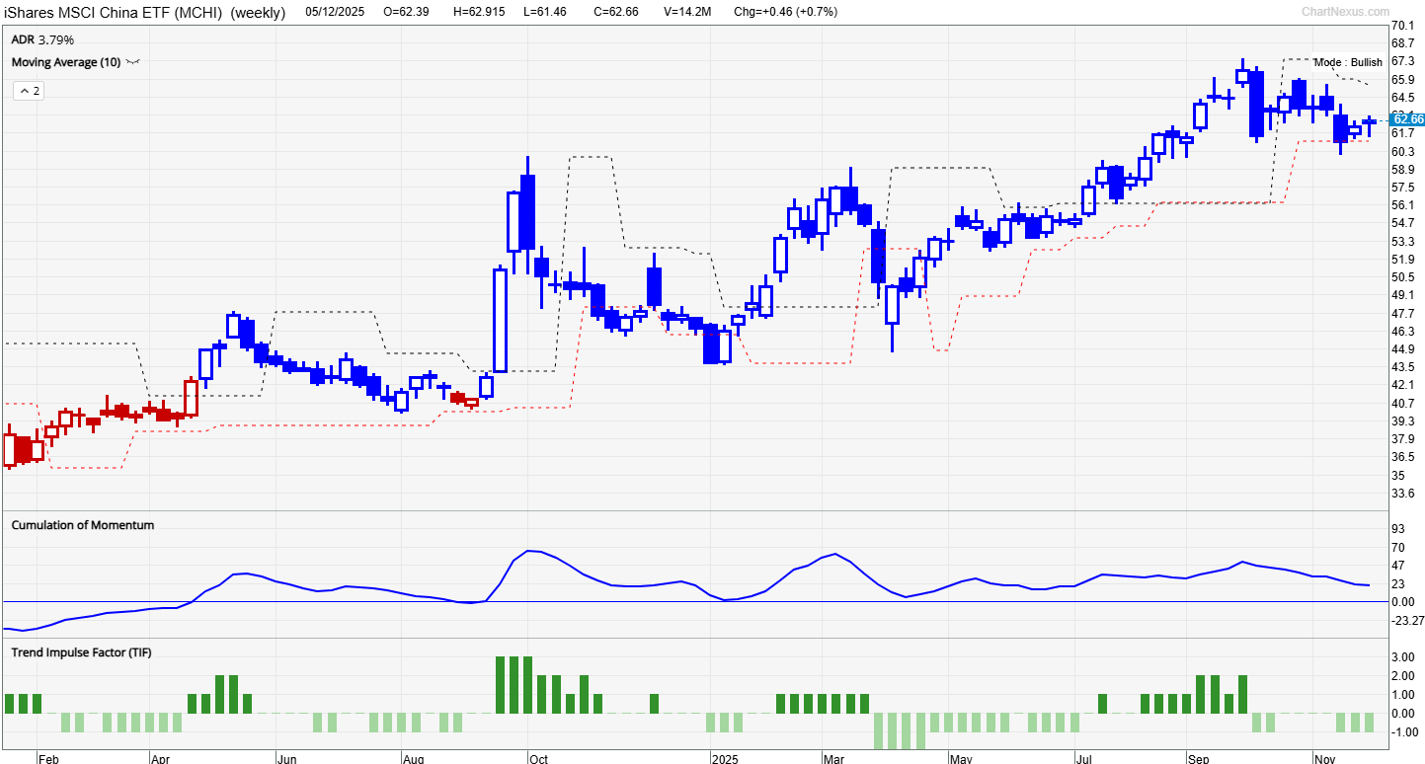
MCHI Weekly Chart: TradersGPS Trend Signal
Our proprietary system, TradersGPS (TGPS), shows the security is in a Bullish trend. Since 2024, the candle colour has been Blue. As per our system, Blue candles indicate the security’s trend is up, while Red candles indicate the security’s trend is down.
Despite the broader volatility in financial markets in April and US-China trade tensions, the colour of the candles didn’t change. This is a reflection that the TGPS system is especially useful for investors with a multi-week investment horizon, allowing them to participate in the trend.
iShares MSCI China ETF (MCHI; Weekly):
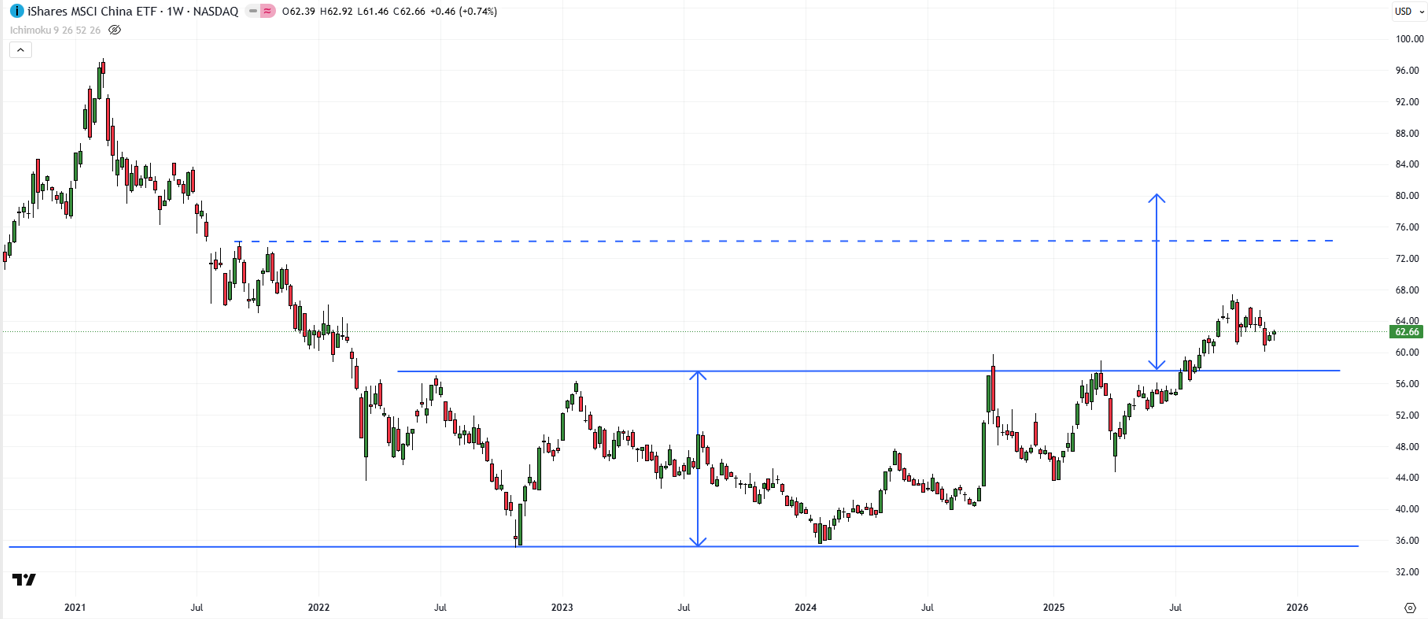
China Equities Key Levels
On technical charts, the trend had been sideways since 2022, with a strong base established around 36. This year, the security has broken out of the range, that is, the upper edge of the range (at about 58). The bullish break has triggered a breakout from the channel, opening the way toward 80 (the price objective of the sideways channel).
Interim resistance is around 65 (the 50% retracement of the 2021-2022 fall), followed by the September-October 2021 high of 73.50. On the downside, the security needs to hold above the resistance-turned-support at 58 for the upward pressure to remain intact.
Only a break below the 2022 and 2024 lows of 35-36 would reverse the bullish outlook.
FAQ
How have China equities performed this year?
The iShares MSCI China ETF (MCHI) is up about 35% year to date, versus roughly 15% for the MSCI All Country World index over the same period.
What’s supporting sentiment in Chinese equities?
Easing trade tensions and attractive valuations have helped sentiment, even as growth remains sluggish and the housing sector stays weak.
What does TradersGPS indicate for MCHI?
TradersGPS shows MCHI in a Bullish trend; since 2024, the candles have stayed Blue, which the system uses to denote an uptrend.
What are the key technical levels for MCHI?
A base formed around 36, with a breakout above ~58 opening a path toward ~80. Resistance is around 65, then 73.50. Support is ~58; a break below 35–36 would reverse the bullish outlook.