About the Security (NYSE: BABA)
Alibaba Group Holding Limited, branded as Alibaba, is a Chinese multinational technology company engaged in e-commerce, retail, internet, and technology.
The company provides consumer-to-consumer, business-to-consumer, and business-to-business sales services via Chinese and global marketplaces.
Stock background:
Alibaba shares jumped 20% so far this week after reports suggesting that the April-June quarter is turning out to be better than expected. The company is due to announce its quarterly earnings in August.
The last quarterly earnings announced in May showed modest revenue growth and a significant drop in core profitability due to aggressive investment in AI.
Hence, any positive news on earnings, especially that AI investment is beginning to pay off, could boost the stock from extreme oversold conditions. The stock is down more than 40% from the 2025 peak.
The broader the narrative of Alibaba has shifted from an e-commerce company to cloud computing and artificial intelligence. Some analysts estimate that the retail e-commerce platform is still the company’s major cash-flow segment.
However, cloud computing is growing strongly, suggesting that diversification is paying off.
BABA (Weekly):
Technical Analysis on Alibaba (NYSE: BABA)
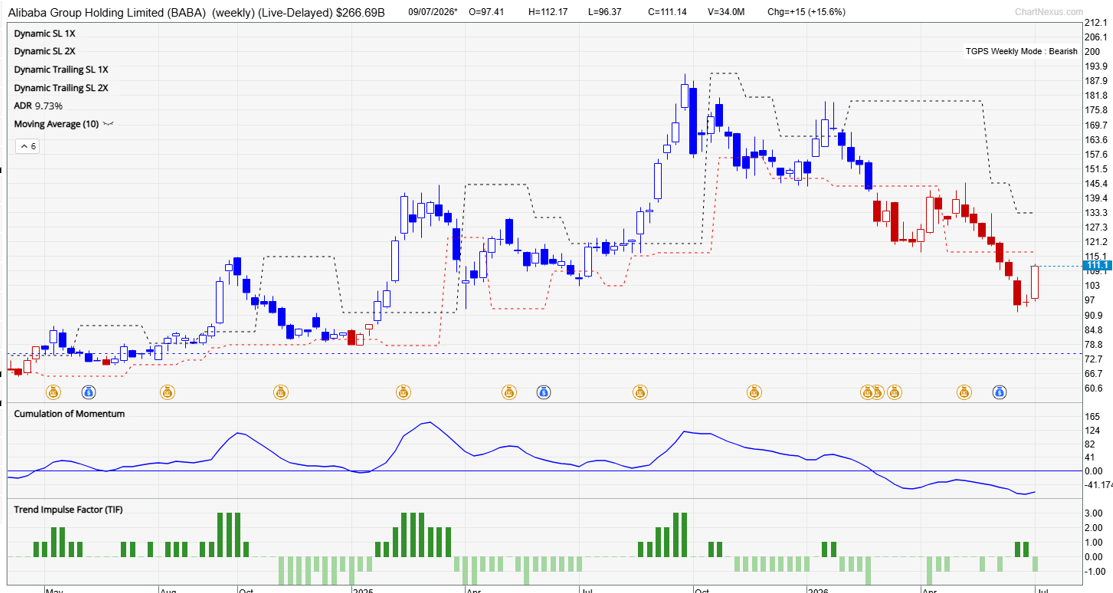
Our proprietary TradersGPS (TGPS) system turned bearish on BABA in March after the stock fell below key support at the end of the 2025 low of 145. As per the system, Blue candles indicate the stock’s trend is up. Red candles indicate the trend is down.
The system is based on trend-following, which enables us to participate in a trend the moment there are signs of the emergence of a sustained trend.
BABA (Weekly):
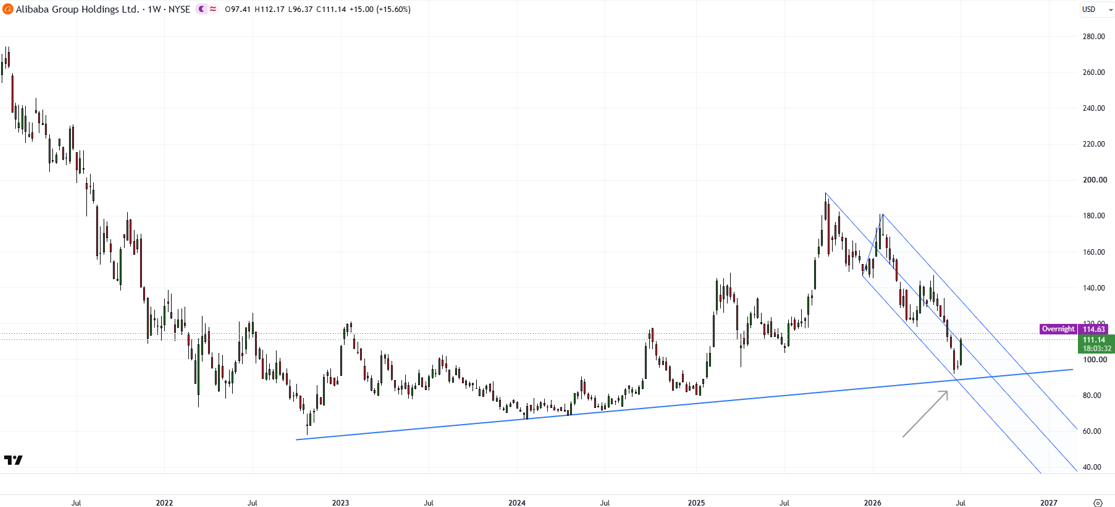
On technical charts, BABA is testing a vital support area around 88-90, which includes an uptrend line from 2022 and the lower edge of a pitchfork channel from last year.
This week’s sharp turnaround raises the chances of a meaningful recovery. A break above immediate minor resistance at the April 2026 low of 118 could confirm that the downward pressure had faded.
Furthermore, any break above subsequent resistance at the May 2026 high of 146 could raise the odds of another leg higher, toward the 2025 high of 192.
On the downside, the next support comes in at the January 2025 low of 80. Major support is at the 2022 low of 58.
Trading Strategy:
Cautious investors might want to wait for the candle colour to turn Blue before considering longs.
But for those looking to dollar-cost average, the dip provides an opportunity. I would be interested in dollar-cost averaging at current levels.
Given there is not much evidence to suggest the stock has bottomed, I would keep a greater cushion on the downside in the event the base building turns out to be prolonged. As always, I could be wrong!