About the Company (NASDAQ: QCOM)
Qualcomm Incorporated creates semiconductors, software, and services related to wireless technology. The company’s dominance in 5G technology remains its key source of growth.
It owns patents critical to 5G and 4G mobile communications standards.
Stock background:
Qualcomm stock has lost close to 40% after hitting a record high of May 2026 at 260. A mix of reasons has been attributed, including profit taking following the sizeable rally, sector rotation out of high-growth technology and chip stocks, and concerns about memory chip supply constraints.
The apparent demand from AI data centers potentially affects supply availability for consumer electronics, which is reflected in QCOM share prices. Furthermore, Nvidia unveiled its new RTX Spark superchip, a powerful processor for Windows PCs, a direct competitor to Qualcomm’s Snapdragon series.
QCOM is due to report Q3 fiscal 2026 earnings on July 29; analysts expect EPS of around @2.22 compared with the company’s guidance range of @2.10 to $2.30. The market will be hoping for updates on the memory chip shortages and their impact.
Technical Analysis on Qualcomm Incorporated (NASDAQ: QCOM)
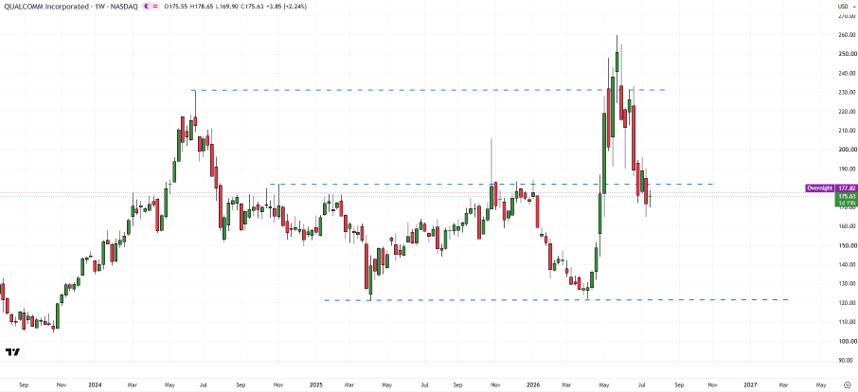
On technical charts, the stock failed to decisively break above vital resistance at the 2024 high of 230. Indeed, the resistance was so formidable that the stock has sharply reversed its uptrend.
In the process, it has created an “A”-type decline.
QCOM (Weekly)
While A-type declines are not uncommon, a noteworthy aspect in the case of QCOM is that the pattern has repeated time and again (see chart below). In 2021-2022, QCOM shares rose above key resistance at the early 2021 high of 168. It stayed above the resistance for a while before retracing much of the gains.
Once again, in 2024, the stock rose above its 2022 high of 194, but couldn’t hold on to gains for long. Subsequently, it retraced nearly all of its previous gains.
The story so far this year is no different.
QCOM (Weekly)
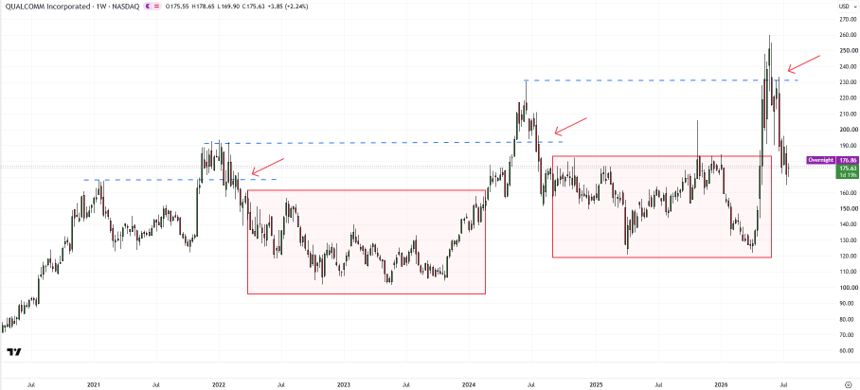
Furthermore, what followed after the slides in 2022 and 2024 was a period of long, sideways trading for months, raising the opportunity cost of holding this stock.
It is too soon to say if this time will be different.
QCOM (Weekly)
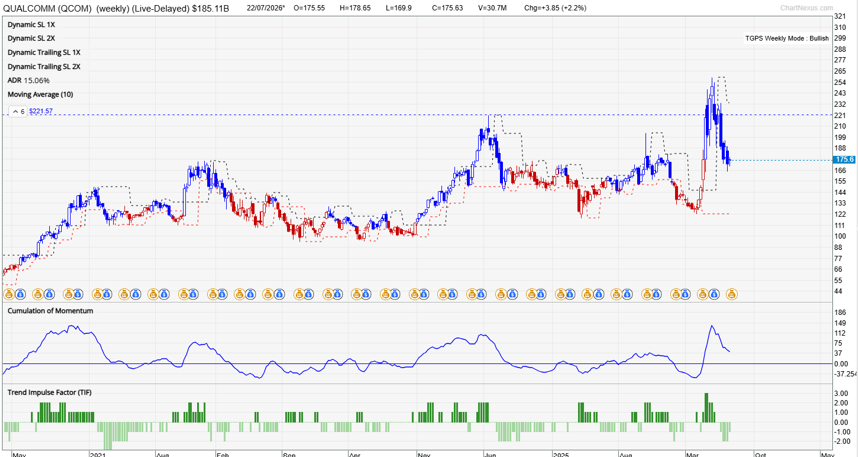
Our proprietary system TradersGPS (TGPS) remains bullish on the stock. As per our system, Blue candles indicate the stock’s trend is up; Red candles indicate that the stock’s trend is down.
A closer look at the trend shows the stock has essentially been in a gradually rising range, with occasional bullish breakouts. The most recent breakout was highlighted earlier this year – “Qualcomm: Gradually heading for a breakout,” dated 7 January 2026. However, as the chart shows, the system tends to do well in a trending market, but less so in a range-bound market.
Trading Strategy
The fragile nature of bullish breaks or the failure to capitalize on gains/bullish breakouts in the recent past makes the risk-to-reward ratio tricky for longs.
Even though the TGPS system continues to remain bullish on the stock, I would prefer to stay on the sidelines for this stock or look elsewhere for opportunities. But of course, as always, I could be wrong!
On technical charts, the recent break below support at the January 2026 high of 184.50 suggests that the stock could be settling in a broad 120-260 range in the interim.