
About the Security (NASDAQ: AAXJ)
iShares MSCI All Country Asia ex-Japan ETF seeks to track the investment results of an index composed of Asian equities, excluding Japan. The ETF’s exposure comprises large to mid-sized companies in emerging and developed Asian economies (excluding Japan).
China accounts for more than a third of AAXJ, followed by Taiwan, India, and South Korea.
Security background:
Asia ex-Japan equities have cleared all hurdles to rise to record highs, led by the strong performance of the Korea and Taiwan markets. Easing US-Iran tensions, global AI boom, and still-attractive valuations have helped regional equities to outperform their US counterparts since the start of this year.
This column had first highlighted the bullish idea in mid-2025 (see “Asian Equities: Finally Out of the Woods?” dated 25 June 2025), and further reiterated earlier this year after the ETF showed strong signs of advancement (see “Asia ex-Japan: Bullish Breakout Points to Further Gains,” dated 26 February 2026. The ETF is up around 40% since the idea was suggested last year.
Equity rally drivers:
The ceasefire struck on April 8 has boosted equity market sentiment – the CNN Fear & Greed Index has rebounded in Greed territory from Extreme Fear territory at the end of March.
Having said that, the continued blockage of the Strait of Hormuz implies that risks are far from over. The hope is that the US-Iran will come to an eventual agreement, which could sustain the optimistic equity market sentiment.
Earnings continue to be a strong driver. As the Q1-2026 US earnings season draws to a close, revenue growth for the S&P 500 was tracking 11%, marking the highest revenue growth since Q2-2022, according to FactSet.
Strong AI-led boost has spilled over on the Asia ex-Japan equities, with Korea and Taiwan equities leading the regional rebound.
In terms of valuations, Asia ex-Japan equities are trading at a slight discount to global peers, based on the forward price-to-earnings ratio.
The grim outlook on the US dollar due to concerns regarding mounting US debt could be instrumental in the diversification of investor portfolios into other asset classes and geography.
AAXJ (Weekly):
Technical Analysis on MSCI All Country Asia ex-Japan (NASDAQ: AAXJ)
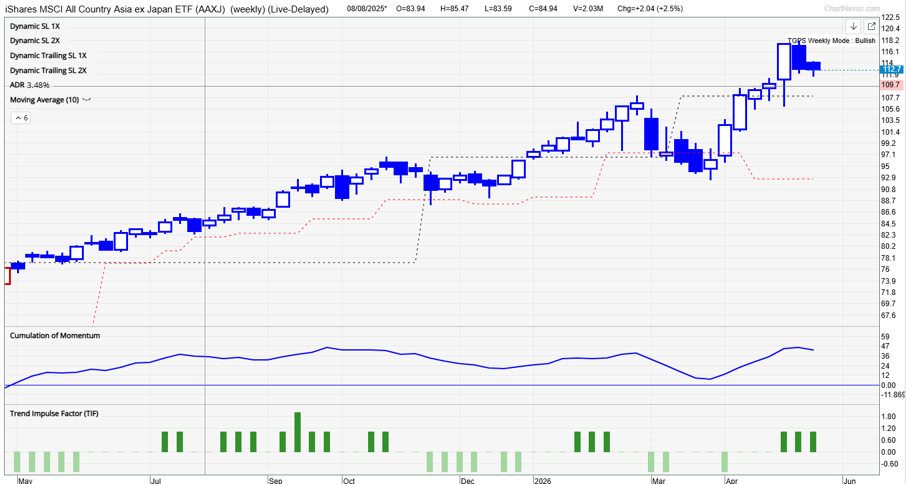
As the accompanying weekly chart shows, our proprietary system TradersGPS (TGPS) has been bullish AAXJ since the middle of last year. As per our system, Blue candles indicate the stock’s trend is up. Red candles indicate the trend is down.
A noteworthy feature of the system is that despite the conflict in the Middle East, the candle colours didn’t change to Red. This highlights that the system is less prone to short-term ‘noise’, allowing passive investors to participate in a trend.
Frequent changes in trend assessments can be less profitable and, at times, frustrating.
AAXJ (Monthly):
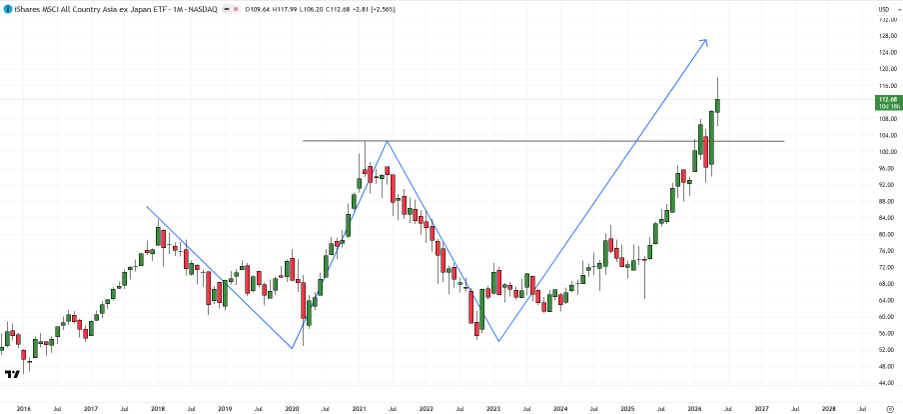
On the monthly candlestick charts, AAXJ’s break above significant resistance at the 2021 high of 102.45 has triggered a major double bottom (the 2020 and 2022 lows), pointing to a potential rise toward 150 based on the measurement of the pattern.
To be fair, technical targets are indicative rather than definitive, and can be characterised by frequent swings.
However, strong momentum on longer-term charts coupled with a strong break above meaningful resistance at the very least shows that regional equities have embarked in unchartered territory.
In terms of strategy, if I were long the ETF, I would look to add in this week’s minor retreat. If I weren’t holding any longs, then I would take advantage of the recent dip to build some exposure.
What are the risks to the bullish outlook?
Renewed US-Iran hostilities and/or a break below key support at the March low of 92.50 would derail the evolving uptrend.