The sharp rebound in risk sentiment has pushed the S&P 500 index close to its record high, and chances are that the index could scale to new heights on growing hopes for a peace deal in the Middle East.
Media reports suggest a second round of U.S.-Iran negotiations is being considered, though no official schedule has been set. This comes soon after the two parties failed to reach an agreement over the weekend in Pakistan.
Market reaction to the breakdown in talks in Islamabad was muted amid growing hopes of an eventual end to the war. The willingness of both parties to come to the negotiation table and put a pause (at least for now) in the military conflict has provided comfort to investors.
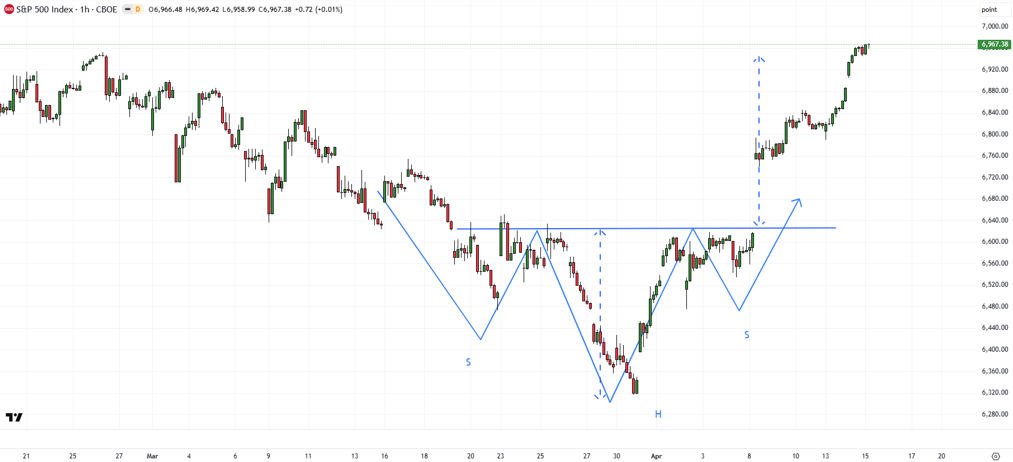
S&P 500 (Hourly):
Earnings Season Boosts Market Confidence
Part of the reason for the sharp rebound is the triggering of a reverse head & shoulders pattern on the hourly chart, as highlighted in last week’s update – see “US Equities: Worst Over?”, published April 9.
The swift rise from oversold conditions — CNN’s Fear & Greed Index hit ‘Extreme Fear’ territory – even in the absence of any concrete deal indicates that ‘work-in-progress’ toward a deal is enough for markets to shift focus away from geopolitics, which has been the prime driver of sentiment in recent weeks.
The first quarter US earnings season has just kicked off with Citigroup and JPMorgan topping estimates. The Q1 earnings growth is estimated to be around 13%, marking the sixth consecutive quarter of double-digit earnings growth reported by the index.
Upbeat earnings growth through the season, while US-Iran negotiations continue, could be a good recipe for stocks to move to fresh highs.
S&P 500 Index (Daily):
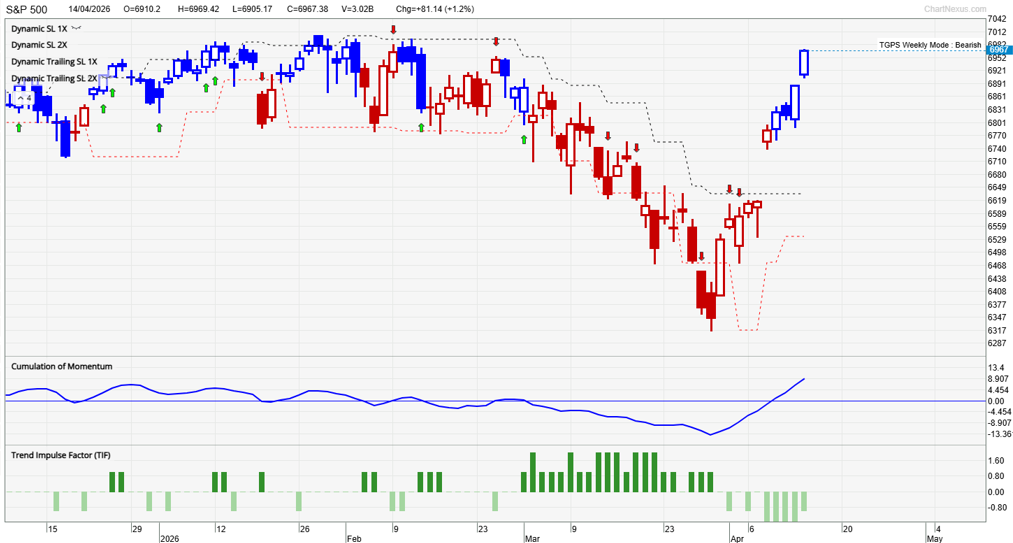
Meanwhile, our proprietary system TradersGPS (TGPS) turned Bullish on the Daily chart last week. Blue coloured candles indicate the trend is Bullish; Red coloured candles indicate the trend is Bearish.
As the accompanying chart shows, the system was able to capture last month’s decline.
S&P 500 (Weekly):
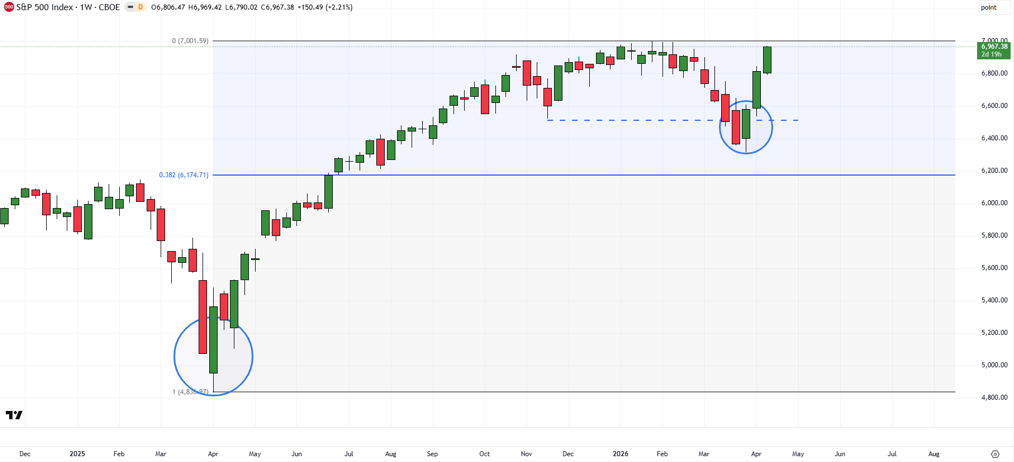
Key Resistance Level
On technical charts, the bullish reversal (price opens lower, makes a new low, but reverses losses to end higher compared to the previous candle) triggered at the beginning of the month reminded investors of a similar reversal triggered in April 2025 as tariff concerns eased.
Back then, the subsequent ‘V’-shaped rebound pushed the index to a record high. This time around, a similar bullish reversal and a similar nature of rebound raise the odds of a break above the early-2026 high of 7002.
Any break above the early-2026 high of 7002 could open the door initially toward 7100 (the upper edge of a rising channel from 2020), potentially the psychological 7500 mark.
The trading strategy remains unchanged from the previous update – aggressive investors may chase momentum; cautious investors may wait for the TradersGPS system to turn bullish on both daily and weekly charts.