About the Security (NASDAQ: MRNA)
Moderna, Inc. is an American pharmaceutical and biotechnology company based in Cambridge, Massachusetts, that focuses on RNA therapeutics, primarily Messenger RNA vaccines (mRNA).
Stock background:
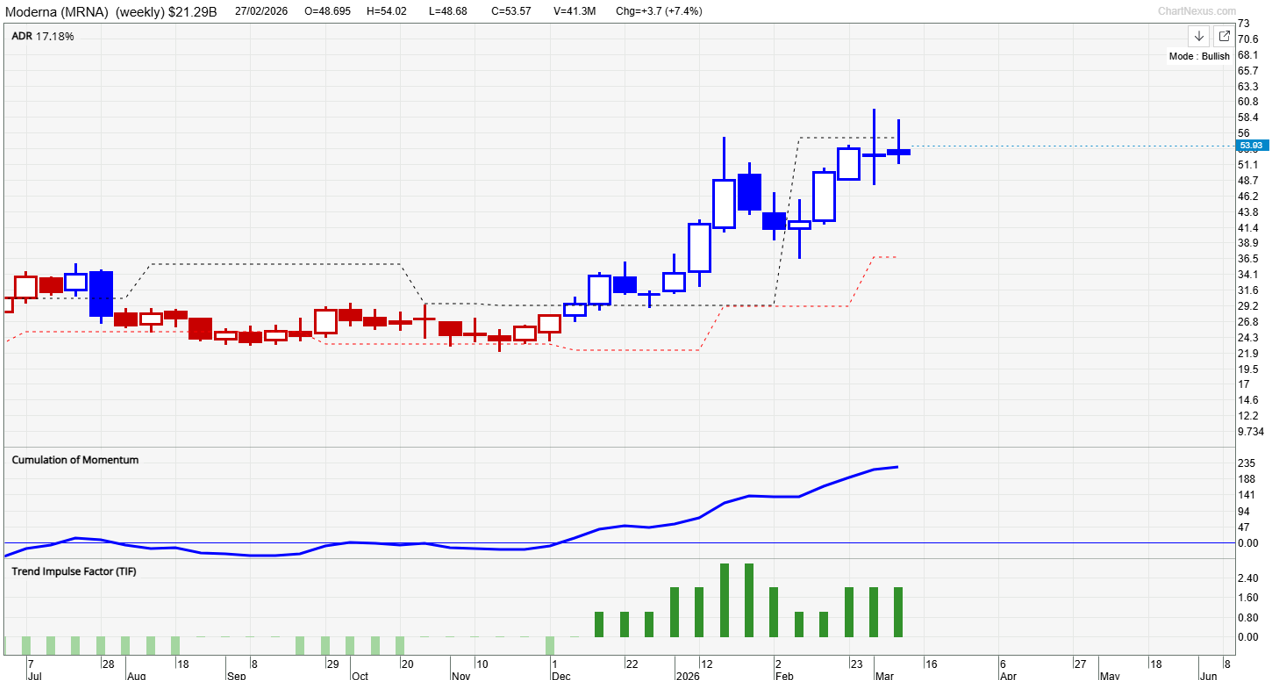
Moderna shares are hovering around 18-month highs despite ongoing tensions in the Middle East. Our proprietary TradersGPS system suggests the medium-term trend has just turned up.
In mid-January, this column first highlighted the possibility of an uptrend developing in the stock. Since then, Moderna shares are up over 40%, albeit with brief interruptions.
At the 44th Annual JP Morgan Healthcare Conference a couple of months ago, the company reiterated its plans to deliver up to 10% growth and further lower its operating expenses, on the path to achieving breakeven in 2028.
Transition Beyond COVID Vaccines
There is little doubt that Moderna has been facing some challenges on the financial front as the demand for COVID vaccines has declined in recent years.
However, the company’s research capabilities, coupled with the focus on oncology and rare diseases, and a new flu vaccine, could aid in transforming the company into a diversified business from a single product focus.
Despite the sharp gains in the stock in recent months, the stock appears to be attractive, trading at 7x price to earnings, according to Yahoo Finance, compared to some of its peers.
Moderna (Weekly chart):
Technical Analysis on Moderna (NASDAQ: MRNA)
As pointed out in January, our proprietary system TradersGPS (TGPS) decidedly turned bullish on the weekly charts at the end of 2025.
As per our system, Blue candles indicate the stock’s trend is up. Red candles indicate the trend is down. Depending on the timeframe in which the signal occurs, the implications for the future trend vary.
For instance, a signal on the weekly timeframe tends to have implications for the trend over a multi-month timeframe.
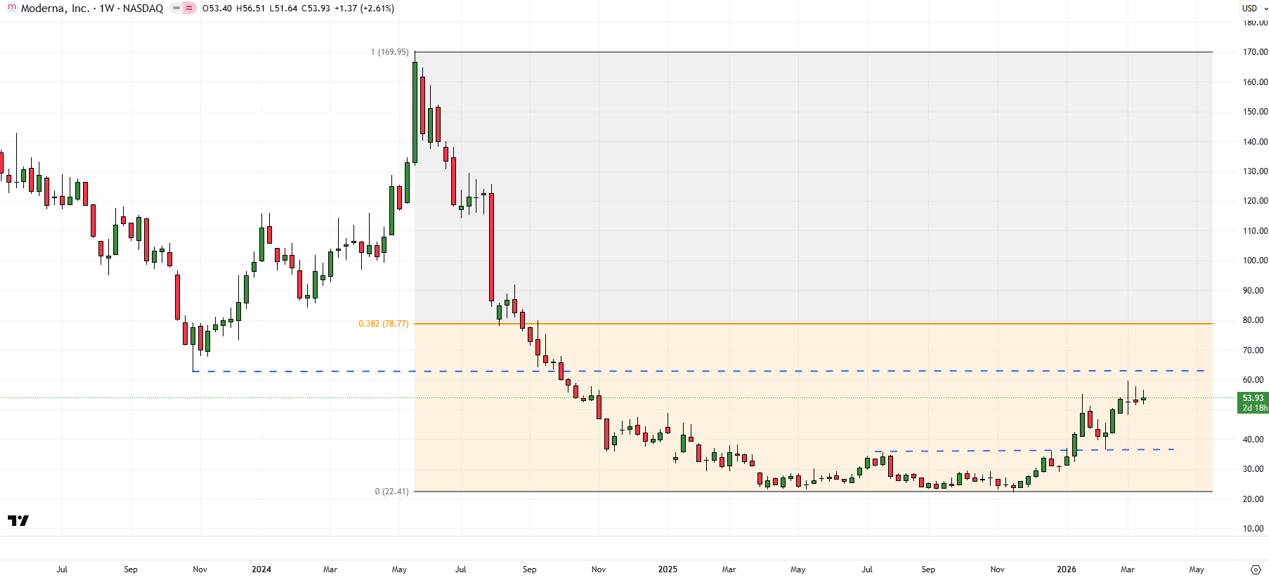
An added confirmation that the trend had decisively turned up in the interim was the break above crucial resistance at the mid-2025 high of 35.60, breaking out of a multi-month sideways pattern.
Moderna (Weekly chart):
Rounding Saucer Pattern Signals Strong Base
On the weekly candlestick charts, a textbook-type rounding saucer pattern suggests that the stock may have made a strong base. The sideways price action from April 2025 through November 2025 is a reflection of accumulation that typically tends to take place around lows.
The break above resistance at 35.50 has opened the way toward the October 2023 low of 62.50. Significant resistance comes in at 78.00 (the 38.2% retracement of the 2024-2025 slide).
On the downside, the stock needs to hold above the February low at 36.50 for the near-term bullish bias to remain force.
FAQ
Why is Moderna’s medium-term outlook improving?
The stock has turned bullish following strong price action, improved growth guidance, and progress in its pipeline beyond COVID vaccines.
What does TradersGPS indicate for MRNA?
The weekly TradersGPS signal turned bullish at the end of 2025, indicating a multi-month uptrend.
What resistance level confirmed the breakout?
The break above the mid-2025 resistance near 35.60 confirmed a trend reversal.
Where is the key support?
The stock needs to hold above 36.50 to maintain its near-term bullish outlook.