
About the Security, AAXJ ETF (NASDAQ: AAXJ)
iShares MSCI All Country Asia ex-Japan ETF seeks to track the investment results of an index composed of Asian equity markets, excluding Japan. The ETF’s exposure comprises large to mid-sized companies in emerging and developed Asian economies (excluding Japan).
Asian Equities Performance in 2025
Asian equities have recouped their underperformance with the rest of the world, now up nearly 30% year-to-date, compared with their US counterparts’ (S&P 500 index) 14% gain – a possibility highlighted in the June 2025 update (AAXJ: Finally Out of the Woods?).
South Korean markets are leading the region with over 70% gains year-to-date, followed by China and Taiwan equities. China accounts for more than a third of AAXJ, followed by Taiwan, India, and South Korea.
A mix of factors has been driving the strength in regional equities:
- Attractive valuations on both an absolute and relative basis (versus peers)
- Under-ownership of Asian equities in investor portfolios
- An improving Asian growth outlook
- Easing trade tensions
- Policy stability in China
- Growing interest in the region’s technology and AI sectors
As pointed out in the June update, mounting US debt and a weakening US dollar are potential catalysts for diversification of investor portfolios into other asset classes and geography.
Gold’s spectacular rise this year is partly a reflection of the diversification theme.
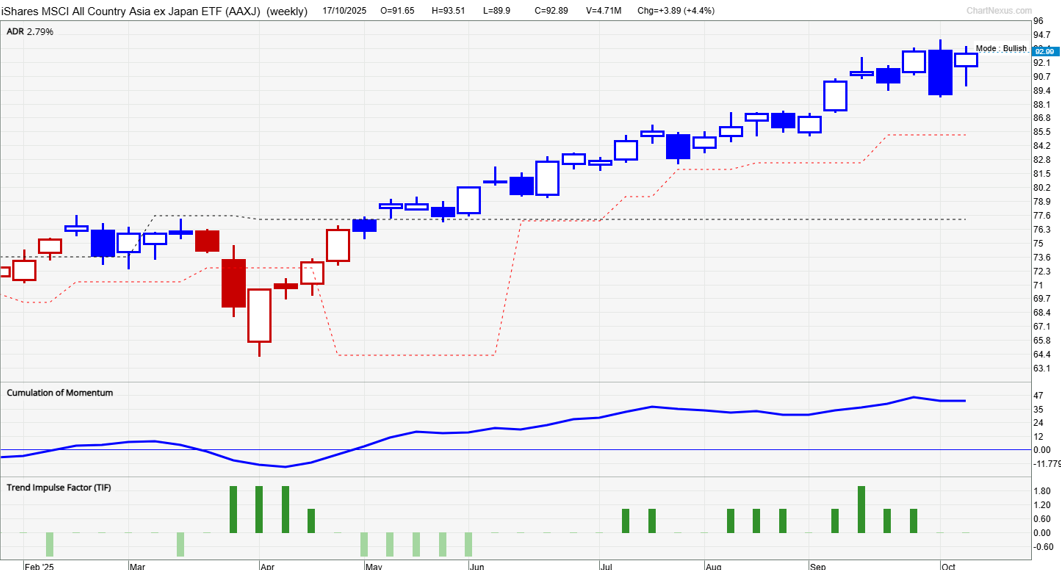
AAXJ (Weekly):
Technical Analysis of AAXJ ETF (NASDAQ: AAXJ)
Our proprietary system, TradersGPS (TGPS), turned decisively Bullish mid-May after the security broke above vital resistance at 77.50.
As per our system, Blue candles indicate the stock’s trend is up. Red candles indicate the trend is down. Since then, the candle colour has remained Blue. What is also noteworthy is that signals on the weekly chart don’t change that often, making it suitable for investors with a multi-month time horizon.
AAXJ (Weekly):

Support and Resistance Levels
On the weekly candlestick charts, following the big 2021-2022 fall, the ETF consolidated with a slight upward bias for nearly 3 years, possibly reflecting accumulation. The sharp rebound since April 2025 triggered a breakout from tough resistance at the October 2024 high of 82.25.
Momentum on the weekly charts (as measured by the Relative Strength Index) hit the highest level since 2021, suggesting the region’s equities may have resumed the long-term uptrend. Strong momentum could push the index toward the 2021 record high of 102.45.
On the downside, there is immediate support at the October 10 low of 89, followed by support on the 100-day moving average (currently at 86.25).
FAQs
What is AAXJ ETF?
The iShares MSCI All Country Asia ex-Japan ETF tracks large and mid-cap Asian equities excluding Japan.
Is AAXJ ETF a good investment in 2025?
Based on technical analysis, the ETF shows bullish momentum with support near $86.25 and potential upside toward $102.45.