
After a sharp rally over the past three months, the uptrend in US equity markets seems to have finally stalled.
To be fair, a disappointing jobs report and renewed trade tensions may have triggered the retreat, but in general, overbought conditions and weak seasonals going into the US second quarter earnings season pointed to a pause in the rally. For more details see “US Equities: Headed for a Breather,” posted on July 16, 2025.
The US Labour Department reported significantly lower-than-expected jobs numbers. In addition, the department revised downwards the jobs gains from May and June. The dismal jobs data has raised concerns that the labour market is deteriorating rapidly due to uncertainty related to tariffs, potentially leading to a slowdown in the economy.
The risk is that higher tariffs could eventually be passed on to consumers, weighing on consumer confidence. Already in the Q2 earnings season, apart from AI-focused companies, the outlook from consumer names has been relatively less optimistic. Last week, US President Donald Trump imposed steep tariffs on exports from a number of countries, including Brazil, Canada, India, and Taiwan.
S&P 500 Index (Weekly):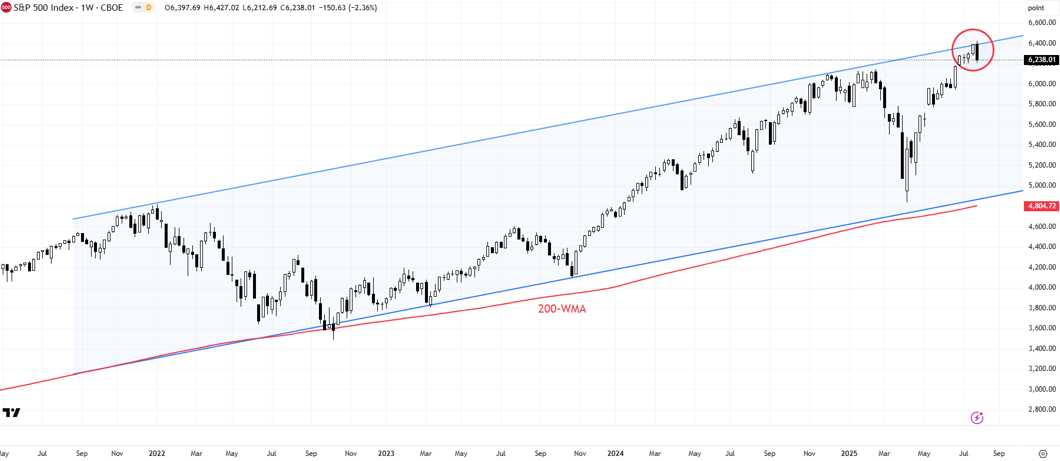
From a seasonal perspective, the July-September period for US equities tends to be the worst compared to the other quarters. A bearish engulfing candlestick pattern on the weekly technical charts of the S&P 500 index at tough resistance suggests this time may not be different. A bearish engulfing pattern is a two-candlestick pattern that occurs at a market high, where a bearish candle completely engulfs the previous bullish candle.
S&P 500 Index (Daily):
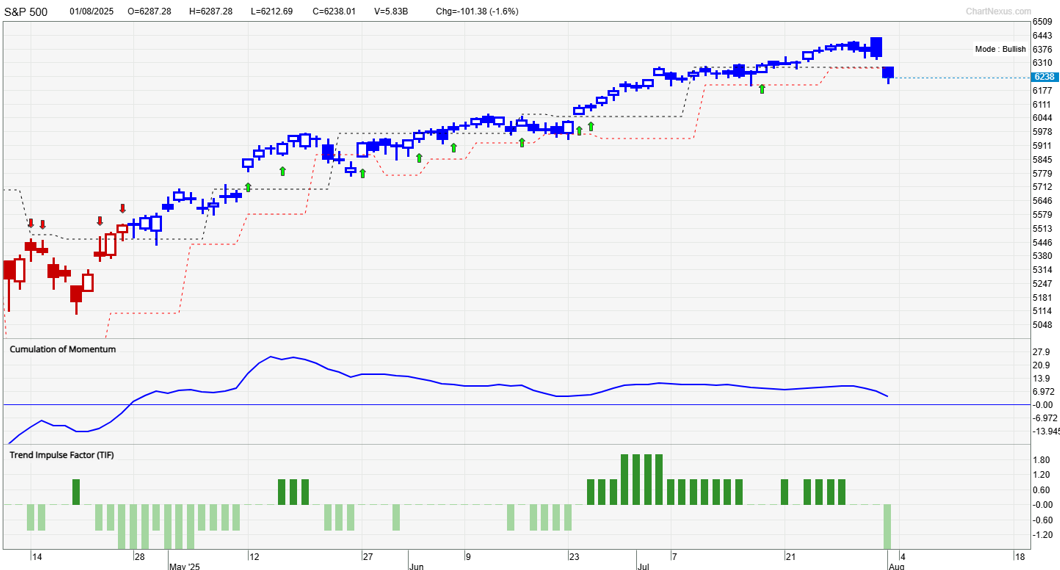
Having said that, last week’s retreat seems like a pause, rather than a reversal of the uptrend. On technical charts, our proprietary system TradersGPS (TGPS) remains Bullish on the S&P 500 index on the daily and the weekly charts. As per the system, Blue candles indicate the stock’s trend is up. Red candles indicate the trend is down. Moreover, the index remains well above major long-term support on the 200-week moving average.
S&P 500 (Daily):
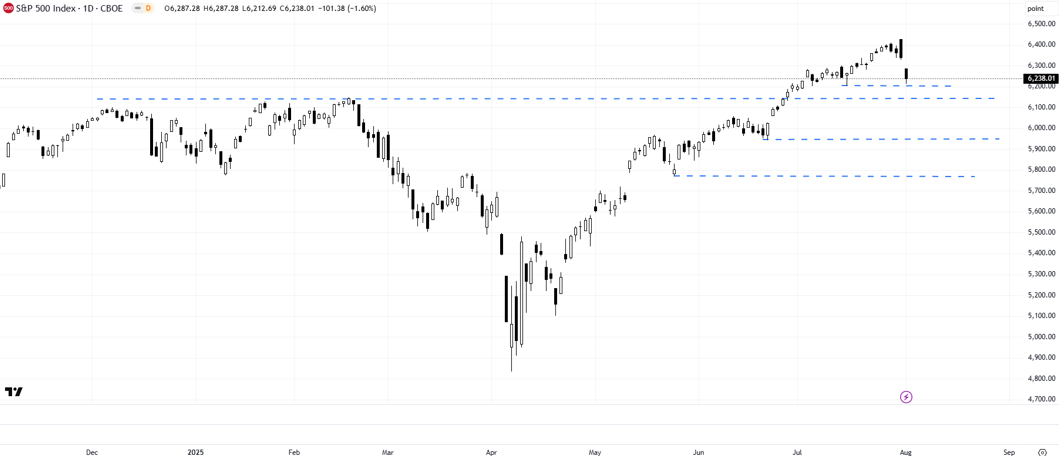
Immediate support is at the mid-July low of 6200, not too far from support at the February high of 6150. Any break below would indicate that the upward pressure had eased slightly temporarily. Subsequent support is at the late-June low of 5950, followed by the late-May low of 5770. The index would need to fall below 5770 for the three-month-long uptrend to change.
On the upside, initial resistance is at last week’s high of 6427, followed by 6700 (the upper edge of a rising channel from 2020). At minimum, the index needs to clear last week’s high for the uptrend to resume.