
About the Company (NYSE: LMT)
The Lockheed Martin Corporation is an American defence and aerospace manufacturer with worldwide interests. It is one of the largest companies in the aerospace, military support, security and technologies industry.
Stock background:
A large part of the decline in the stock in recent months can be attributed to a mix of factors, including operational challenges, cost overruns, and the failure to secure the $20 billion Next Generation Air Dominance contract in March 2025, according to analysts.
The company reported better-than-expected first-quarter profit in April and reaffirmed its forecasts for the year on resilient demand for its defence products and fighter jets. The defence industry’s outlook remains strong, given lingering geopolitical tensions, leading to the possibility of increased defence spending worldwide. Moreover, Lockheed Martin has underperformed the US Aerospace and Defence sector and the broader S&P500 index.
Technical Analysis on Lockheed Martin (NYSE: LMT)
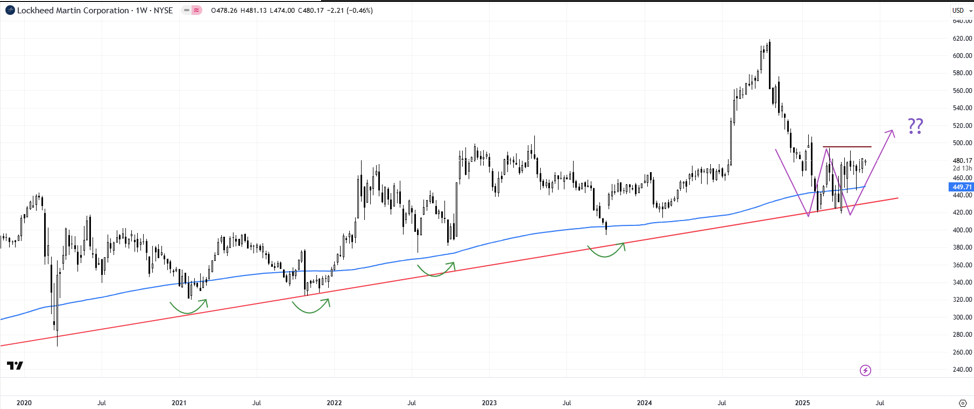
Lockheed Martin made a record high in October and has maintained a weak bias since. The stock fell over 30% before finding a floor around strong converged support on the 200-week moving average, roughly coinciding with an uptrend line from early 2020.
As the chart shows, the converged support has withstood the test of time in recent years. Of course, this time could be different, and the stock could decline further. In this regard, initial resistance at the March high of 495 would be key to watch. Any break above 495 would trigger a double bottom (the February and April 2025 lows), pointing to a potential rise toward 550-570.
Lockheed Martin (Weekly Chart):
Furthermore, our proprietary system TradersGPS (TGPS) shows the stock is turning Bullish. The emergence of Blue candles in recent weeks is a sign that the tide could be changing for the stock.
As per our system, Blue candles indicate the stock’s trend is up, while Red candles indicate the stock’s trend is down. Since March, the stock has repeatedly tested stiff resistance at 495, but failed to break higher. However, a series of Green Arrows in recent weeks could be a sign that the stock could be about to take off.
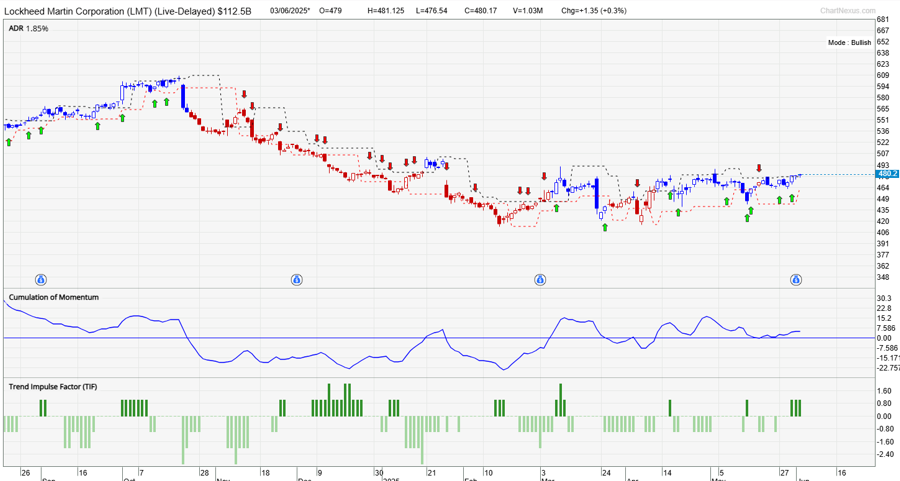
On the downside, there is immediate support at the February and April lows of 418-420.
The risk is that the stock breaks below 418-420, opening the way initially toward the October 2023 low of 394 or possibly the October 2021 low of 325. From a fundamental perspective, the operational challenges for the company, especially for the F-35 upgrade, may not be over – a potential headwind for the stock.