
Expectations of lower interest rates are likely to keep US equities supported amid still-strong earnings growth and decent US economic growth.
The US Federal Reserve reduced its benchmark interest rate on Wednesday by a widely expected 25 basis points, and projected three more rate cuts in the coming months. The key driver for the central bank was the slowing pace of job growth against the backdrop of sticky inflation and the downshift in economic activity.
According to the Fed Watch tool, after Wednesday’s rate cut, the market is pricing in two more rate cuts until the end of 2025, and 2-3 more rate cuts next year. That compares with the Fed’s projection of two more rate cuts this year, and just one cut in 2026.
In the near term, notwithstanding any ‘buy-the-rumor-sell-the-fact’ related position adjustments, the path of least resistance for the index remains up. Monetary policy boost, strong earnings growth, and moderation in economic growth imply a good spot for equities to be in.
While the current year market views on monetary policy seem to be aligned with the Fed’s, the divide in market expectations and Fed projections for 2026 means more uncertainty next year. That means, for the equity market, the trajectory for next year could be trickier compared to the rest of 2025.
The Fed projects a slightly faster economic growth next year, coupled with slightly higher price pressures. Inflation is perceived to be key for the outlook on interest rates. To what extent the impact of tariffs feeds through price pressures would ultimately determine the flexibility the US central bank has in terms of lowering rates.
Moreover, the replacement for Fed Chair Powell, whose term expires in May 2026, adds another element of uncertainty given questions surrounding the central bank’s independence.
S&P 500 Index (Weekly):
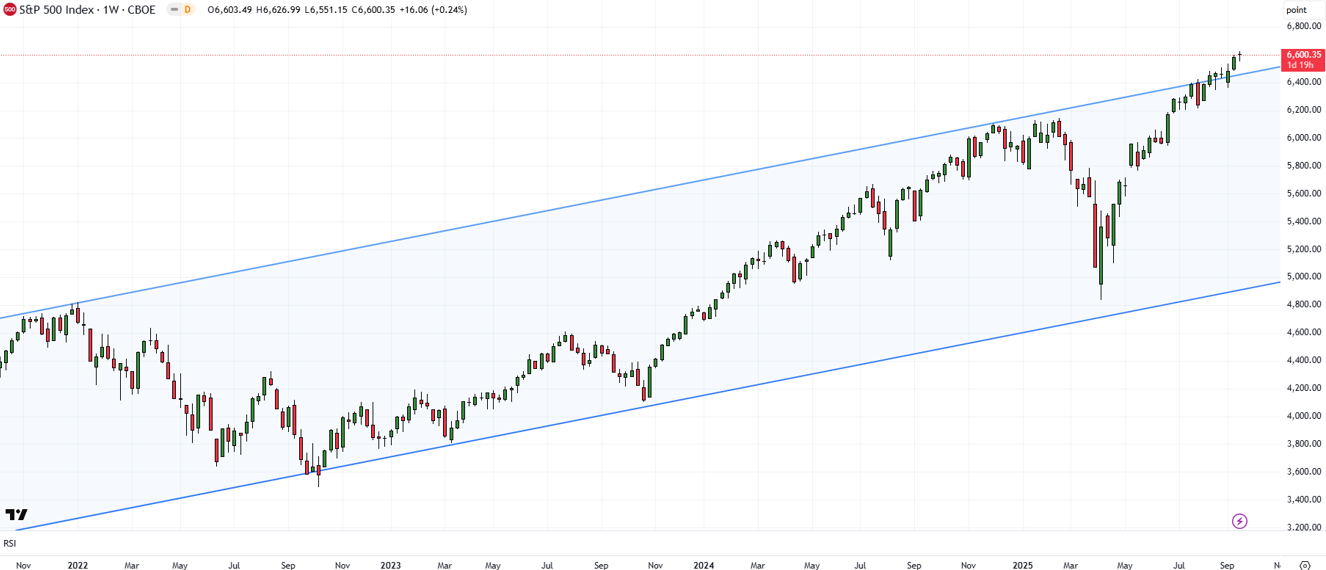
For now, though, the trend is our friend. On technical charts, the S&P 500 index continues to post higher-highs-higher-lows – the hallmark of an uptrend. It is now attempting to break resistance on the upper edge of a rising channel from the end of 2021. Such a break could pave the way toward the psychological 7000 mark in the coming months.
S&P 500 Index (Weekly):
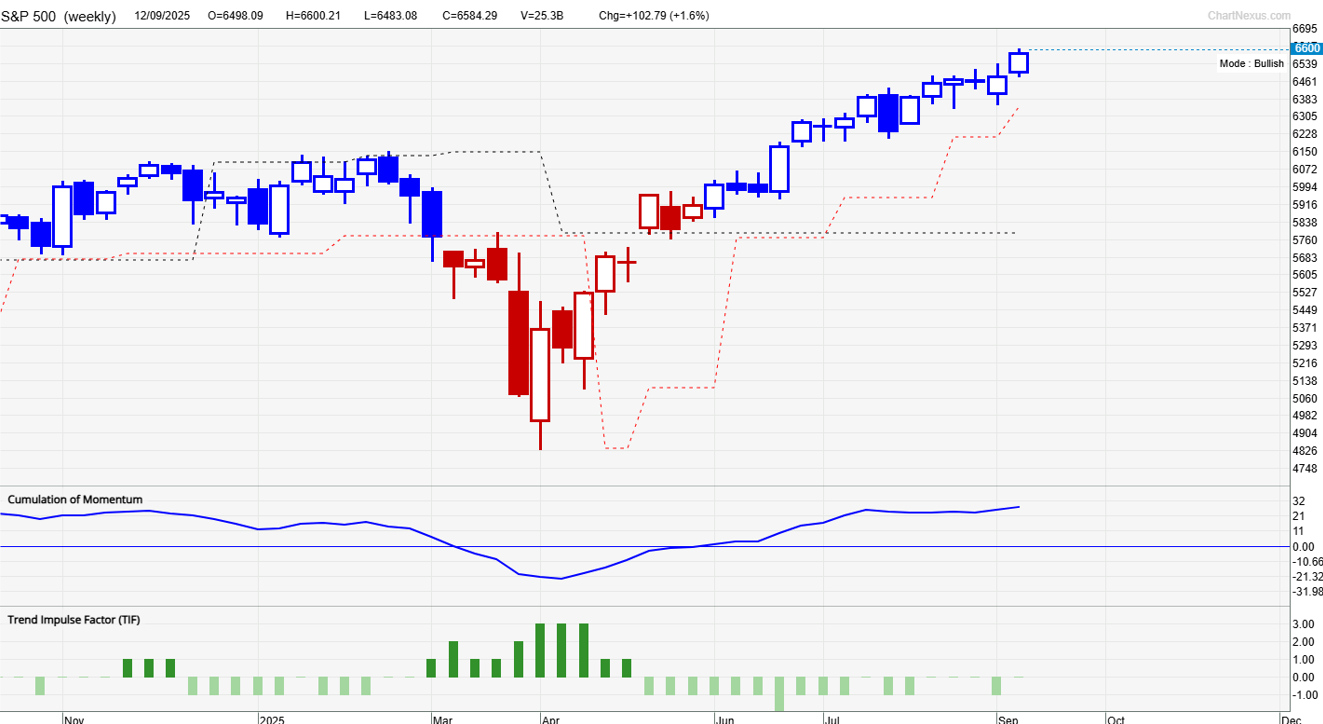
Our proprietary system TradersGPS (TGPS) remains Bullish on the S&P 500 index on the daily and the weekly charts. Blue coloured candles indicate the trend is Bullish; Red coloured candles indicate the trend is Bearish. After a slower pace of gains in recent weeks, the big blue candle last week, coupled with a new record high, is a reassertion of the uptrend.
S&P 500 (Daily):
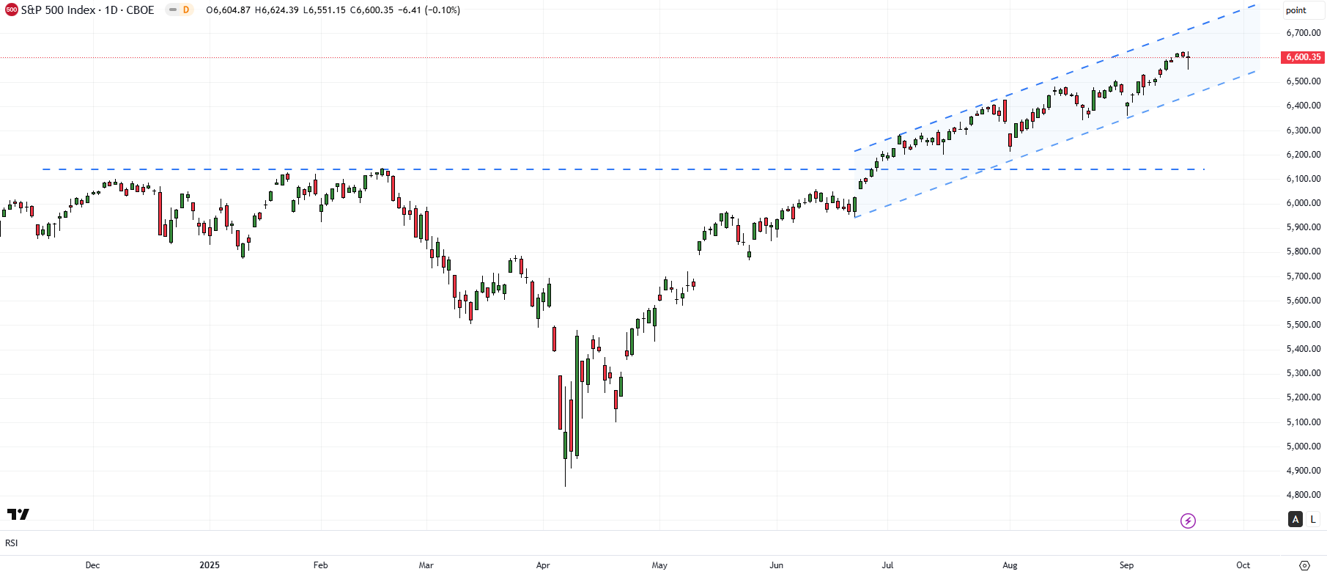
On the daily chart, despite the broadly sideways trend in recent weeks, the index maintained the sequence of marginally higher highs while not breaking any meaningful support.
Meanwhile, the index is cruising along nicely in a minor upward channel since June/July. For the short-term trend to break down, the index at a minimum needs to fall below the early-September low of 6360. A stronger support is the early 2025 high of 6147. We would be closely watching support levels for any signs of weakness in equities.