Speaking to various students from our Systematic Trader graduates’ community, the question raised is whether there will be “buy-the-rumor-sell-the-fact” after next week’s key US Federal Open Market Committee (FOMC) meeting. In this article, we will try to address the question.
US equities have broadly consolidated in recent weeks, albeit with a slight upward bias — a possibility first highlighted in “US Equities: Headed for a Breather,” posted on July 16, 2025. Growing expectations that the US Fed will cut interest rates at the September 16-17 meeting are keeping US equities well supported.
According to the FedWatch tool, markets are pricing in a 94% chance of a 25bp rate cut next week, and about 6% chance of a 50bp move. Markets are pricing in 61% chance of another 25bp rate cut at the December meeting. Indeed, fresh record highs can’t be ruled out ahead of next week’s rate decision.
Federal Reserve Chair Jerome Powell’s annual address at the Jackson Hole symposium in August opened the door for a September interest rate cut. Hopes of a rate cut were further cemented by the weakening in the US jobs market. Furthermore, the significant downward revision of annual jobs growth suggests the economy could be on a weaker footing than initially thought – a point echoed by JPMorgan CEO Jamie Dimon.
The noteworthy deterioration in the US labour market possibly justifies an earlier rather than later easing in monetary policy. Looser monetary policy stance is likely to underpin share prices, given that earnings growth remains strong, for the third consecutive quarter, earnings growth clocked double-digit gains in the Q2 earnings season.
So it appears that even if there is ‘sell the fact’ after next week’s widely-expected Fed rate cut, the downside in equities could be limited (other things remaining unchanged of course).
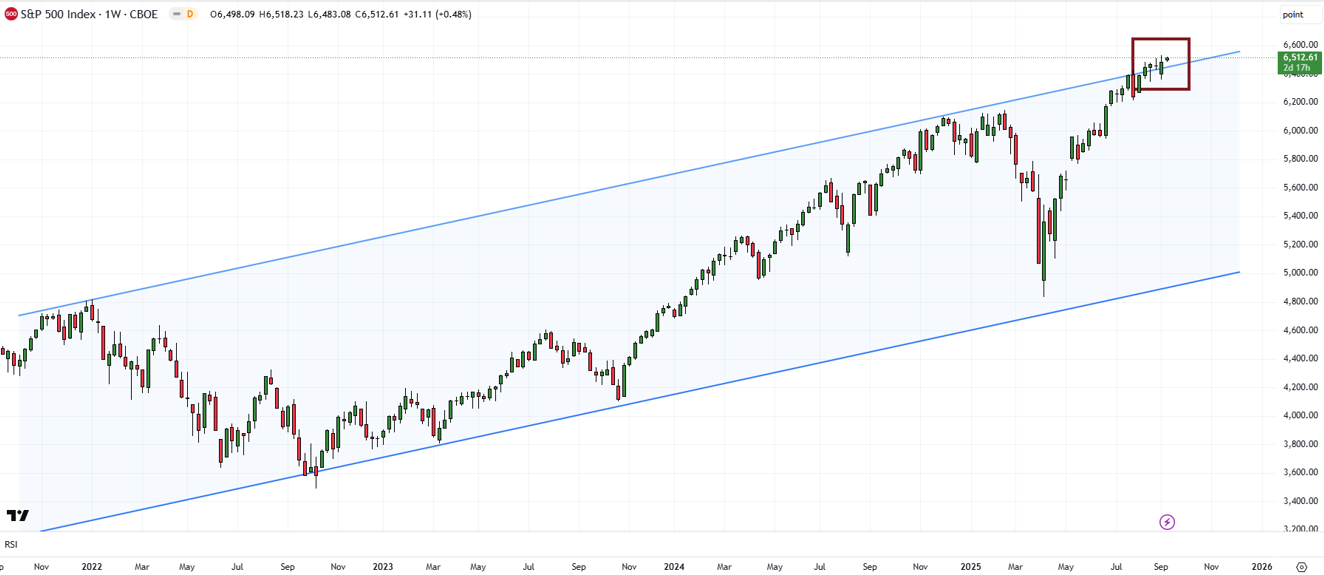
S&P 500 Index (Weekly):
The risk is not so much for next week as for the outlook in subsequent months. It is a matter of time before higher tariffs are eventually passed on to consumers, potentially hurting on consumer confidence and spending. This suggests that the outlook on monetary policy could be less certain next year. And if economic growth slows, then the path for equities for next year remains tricky. For now, though, as the popular adage goes, the trend is our friend!
On technical charts, the S&P 500 index is attempting to break above tough resistance on the upper edge of a rising channel from the end of 2021. Such a break could pave the way toward the psychological 7000 mark in the coming months.
S&P 500 Index (Weekly):
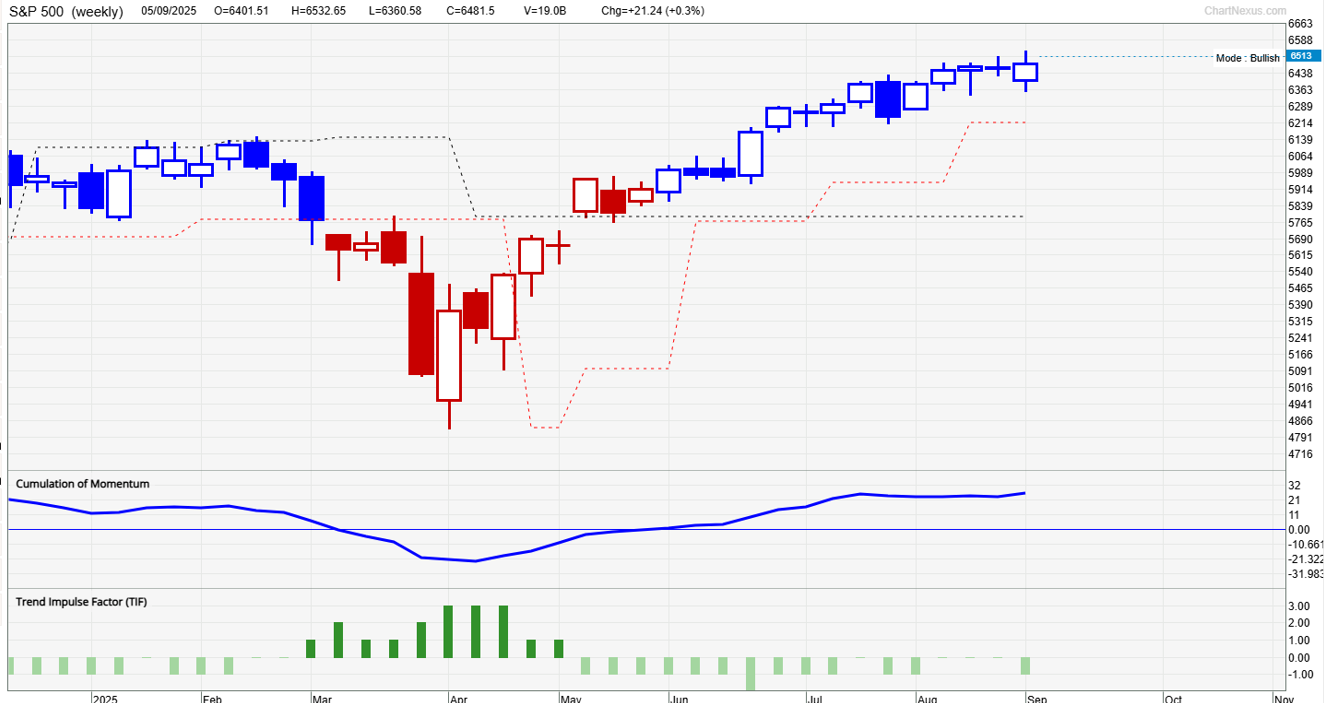
Moreover, our proprietary system TradersGPS (TGPS) remains Bullish on the S&P 500 index on the daily and the weekly charts. Blue coloured candles indicate the trend is Bullish; Red coloured candles indicate the trend is Bearish. One of the biggest advantages of having and following a system is that it removes any potential bias from the market assessment. Hence, we would rather wait for the candle colour to turn Red on the weekly chart before turning bearish on the market.