US equity markets are at a record high as the US second-quarter earnings season kicks in. Fresh tariff uncertainty, overbought conditions, and weak seasonals suggest the bar is high for equities to continue the three-month upward momentum. Indeed, markets may pause for a breather within the broader uptrend.
The S&P 500 index is up 30% from its April low as trade tensions have eased following the US President Donald Trump’s postponement of tariffs until July. The technology-heavy Nasdaq 100 index is up nearly 40% during the same period.
However, tariff concerns have resurfaced after the US President Trump threatened to impose a 30% tariff on goods from the European Union and Mexico starting August 1. He has sent similar letters to other trading partners, including Canada, Japan, and Brazil. On Tuesday, the president told reporters that letters would be going out soon for many smaller countries.
S&P 500 Index (Daily):
So far, deals have been reached with the UK, Vietnam, Indonesia, and an interim deal with China. Markets have been working on the assumption that the US will be able to carve out deals with its trading partners. However, the path toward the resolution could be bumpy, especially as the Q2 US earnings season has kick started.
JPMorgan, Wells Fargo, and BlackRock earnings announced on Tuesday exceeded expectations. However, shares eased from recent highs. Part of the reason for the outperformance in earnings is that earnings expectations for the current earnings season have been downgraded since the start of the year as a result of tariff uncertainties. While the hurdle for companies to beat earnings has reduced, Tuesday’s muted reaction following the earnings announcement suggests much of the optimism could be in the price.
S&P 500 Index (Daily):
Furthermore, historically, the July-September period for US equities tends to be the worst compared to the other quarters. With the benchmark index at record high, it would be hard to argue that ‘this time is different’. In contrast, when an index is starting the quarter at a low (downtrend in the previous quarter or two), the law of averages can be challenged.
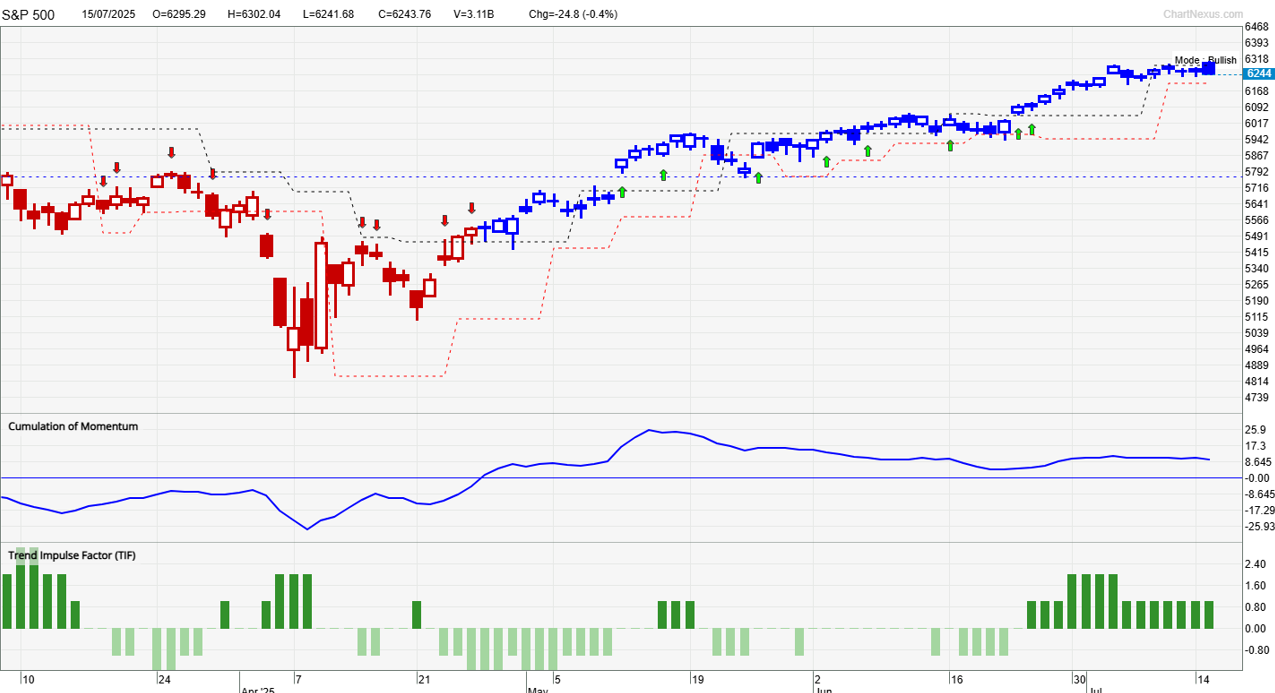
On technical charts, our proprietary system TradersGPS (TGPS) turned Bullish on the S&P 500 index in April — the colour of the candles turned Blue at the end of April, indicating the index was in an uptrend. As per the system, Blue candles indicate the stock’s trend is up. Red candles indicate the trend is down. The overall trend continues to up, notwithstanding the easing of momentum recently.
S&P 500 (Weekly):
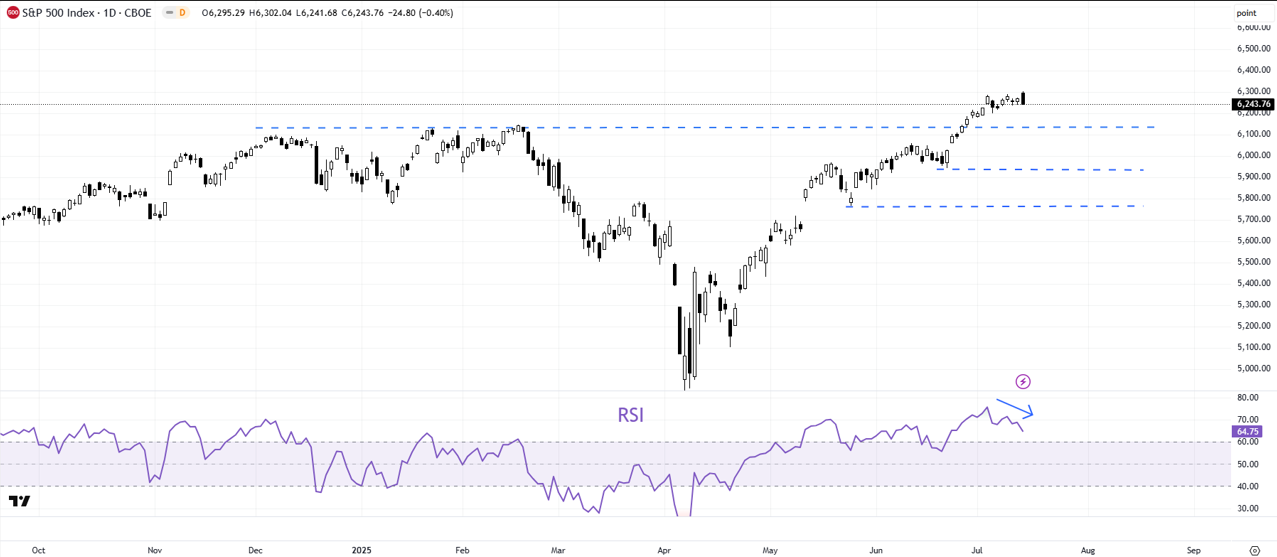
Negative divergence (rising price associated with declining momentum) on the daily chart of the index suggests the rally is losing steam. To be sure, a negative divergence doesn’t necessarily imply a reversal of a trend – it could well be a pause. In this regard, key focus is on immediate support at the February high of 6150.
Any break below would indicate that the upward pressure had eased slightly (but not reversed). Subsequent support is at the late-June low of 5950, followed by the late-May low of 5770. The index would need to fall below 5770 for the three-month long uptrend to change. In the absence a break, the path of least resistance remains up.
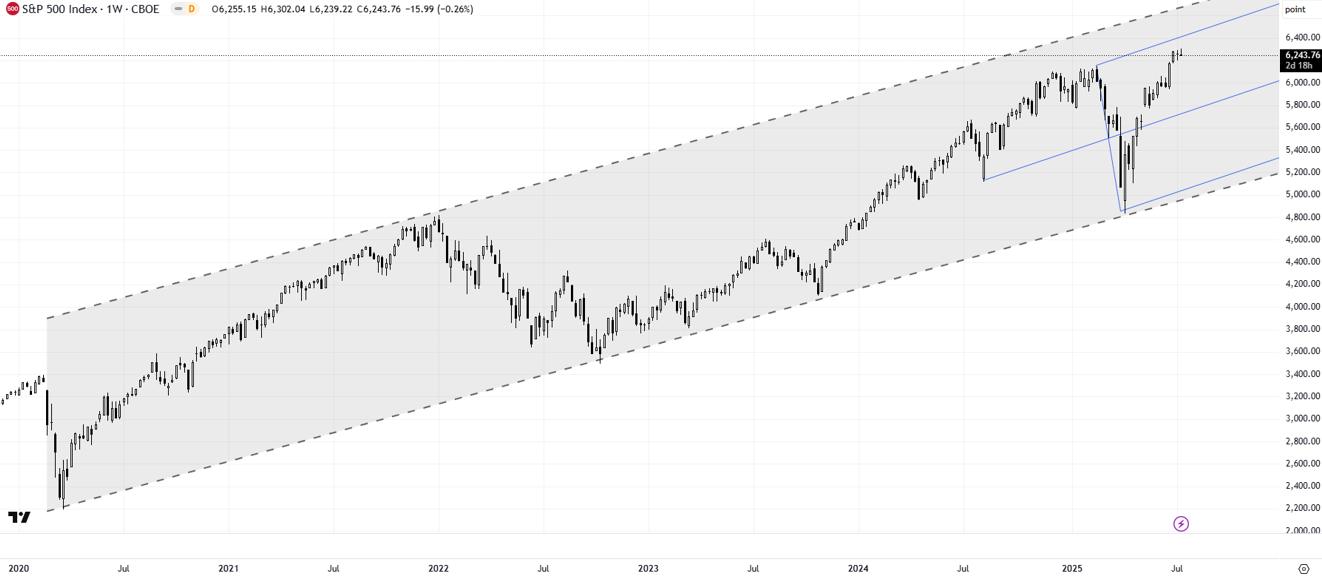
Meanwhile, on the upside, there is initial resistance on the upper edge of the pitchfork channel from late-2024 (now at about 6425), followed by the upper edge of a rising channel from 2020 (now around 6700).