
About the Company (NYSE: LMT)
The Lockheed Martin Corporation is an American defence and aerospace manufacturer with worldwide interests. It is one of the largest companies in the aerospace, military support, security, and technology industry.
Stock background (NYSE: LMT):
After a year of lacklustre price action, Lockheed Martin shares are finally gearing up for a bullish breakout. The calendar year 2026 has kicked off on a solid note after the company announced a landmark contract with the US Department of Defense, giving the company long-term demand certainty.
The stock was in need of a strong bullish catalyst in recent months, and this week’s announcement has likely opened the door for further advance. Focus is now on the October-December quarter earnings and the earnings call at the end of this month.
Analysts are hoping that the management will address the outlook on profitability after recent financial charges and the topic of cost overruns.
A large part of the decline in the stock from late 2024 can be attributed to a mix of factors, including operational challenges, cost overruns, and the failure to secure the $20 billion Next Generation Air Dominance contract in March 2025, according to analysts.
Broadly, the defence industry’s outlook remains strong given lingering geopolitical tensions, leading to the possibility of increased defence spending worldwide.
Technical Analysis on Lockheed Martin (NYSE: LMT)
Our proprietary system, TradersGPS (TGPS), continues to show that the stock is Bullish.
Blue candles indicate the stock’s trend is up, while Red candles indicate the stock’s trend is down. The system was able to capture the period of negative returns from late 2024 until late 2025 before the colour of the candles changed to Blue.
Aside from the sole red candle, which appeared at the end of last year (which could be due to rounding off decimals), the stock’s trend as per our system has been up. Most recently, the emergence of big white shaded candles is a sign that the upward momentum is picking up.
Lockheed Martin (Weekly Chart):
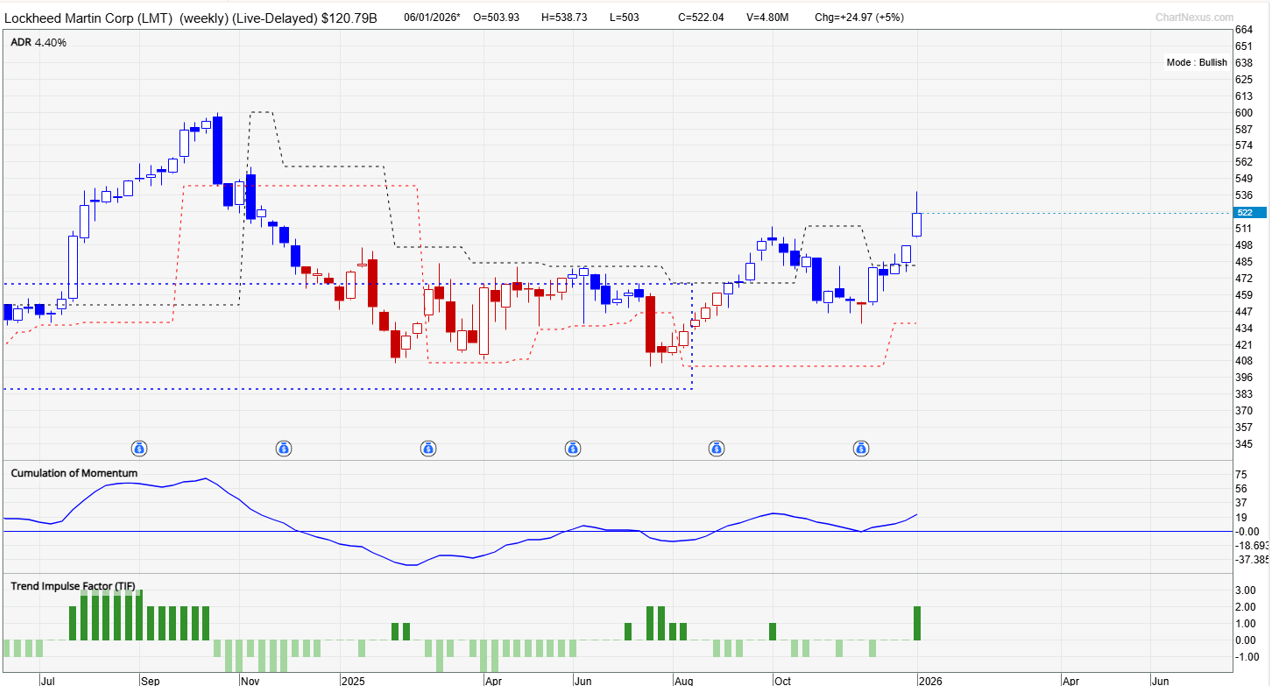
In recent months, Lockheed Martin shares have been capped by stiff resistance at 495-515 (includes the March 2025 high and the October 2025 highs).
However, the stock is now attempting to break above the upper edge of the resistance. A decisive break (at least 1 weekly close) above the resistance could open the way toward the record high of 619.
LMT made a record high in 2024 before losing the upward momentum. Despite the weakness, the stock has held above quite strong support on an uptrend line from early 2020. The trendline has withstood the test of time in recent years, including the selloff around COVID-19 and tariff tensions in April 2025.
Lockheed Martin (Weekly Chart):
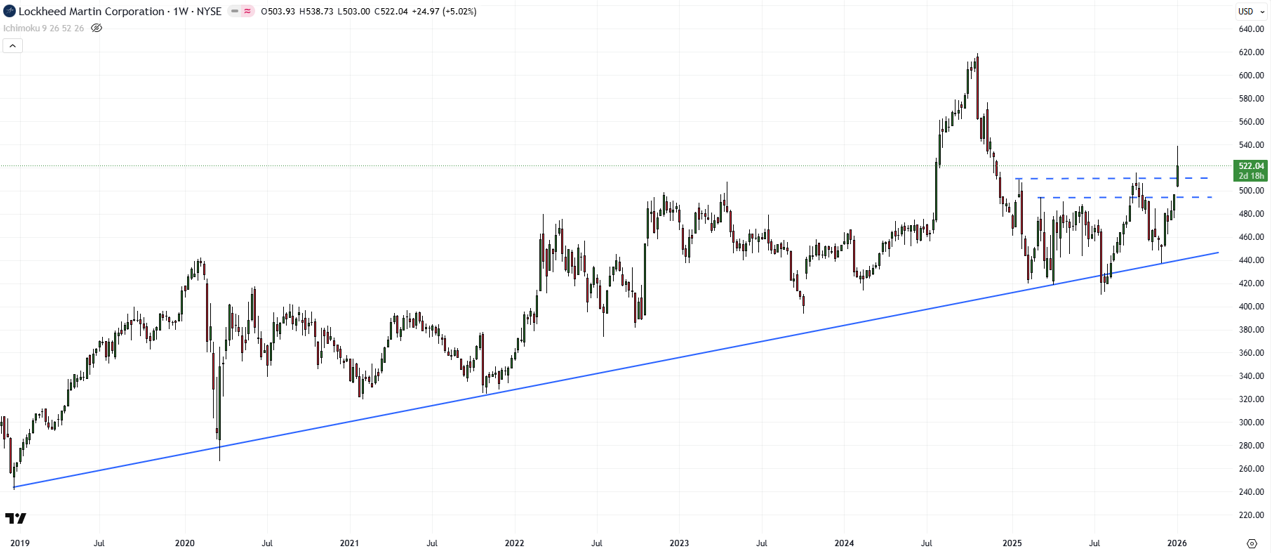
On the downside, the uptrend line from 2020, roughly coinciding with the July 2025 low of 410, continues to provide a solid floor. In addition, there is the December low of 437. Any downside could be restricted to be restricted given a convergence of support.
FAQ
Why is Lockheed Martin showing signs of a breakout now?
The announcement of a long-term US Department of Defense contract has provided a strong bullish catalyst after a prolonged consolidation phase.
What does TradersGPS indicate for LMT?
TradersGPS has turned Bullish, with blue candles dominating the weekly chart and recent large white candles signalling strengthening momentum.
What resistance levels should investors watch?
The key resistance zone lies between 495 and 515. A confirmed weekly break above this range could open the path toward the record high near 619.
Where are the key support levels?
Major support is provided by the long-term uptrend line near 410, with additional support around the December low of 437.