About the Security (NASDAQ: INTC)
Intel Corporation is an American multinational technology company headquartered in Santa Clara, California. Intel designs, manufactures, and sells computer components such as central processing units and related products for business and consumer markets, according to Wikipedia. It was reportedly the world’s third-largest semiconductor chip manufacturer by revenue in 2024.
Stock background:
Intel shares have soared in recent weeks, thanks to renewed interest and capital injections in the company, and broader optimism toward semiconductor stocks. Around mid-August, we highlighted Intel as a potential stock to watch. See “Intel: Preparing to Takeoff?”, dated 20 August 2025.
The capital inflow from Nvidia, Softbank, and a potential 10% stake in Intel by the US administration suggests the company’s fortunes could be changing as semiconductor production expands further in the US, with Intel emerging as a key player.
Intel shares have nearly doubled since the start of 2025, with most of the gains secured over the past couple of months. Intel has now outperformed some of its peers, including Nvidia and AMD, in the calendar year 2025. Nvidia is up roughly 40% while AMD is up nearly 80% during the same period (including the 24% surge following the news of OpenAI’s stake in the company).
Intel (Weekly):
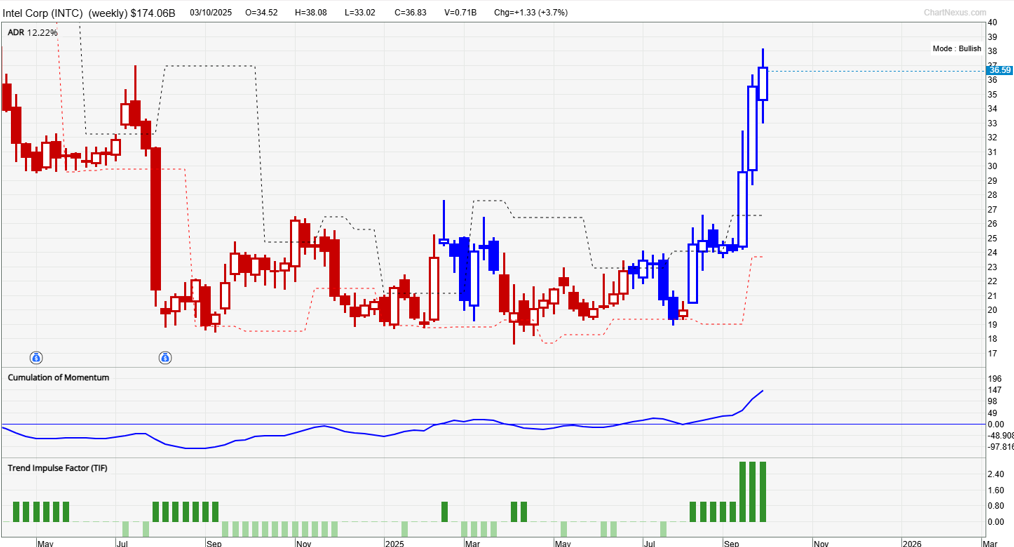
Technical Analysis on Intel (NASDAQ: INTC)
Our proprietary system TradersGPS (TGPS) has been largely bullish since June/July 2025. As per our system, Blue candles indicate the stock’s trend is up. Red candles indicate the trend is down. As noted in the previous update, this is not the first time in recent months that the system has turned bullish on the stock. Perhaps what is different this time is the sharp upward momentum in the stock market recently. This has been reflected in the big blue candles, which coincided with a break above key resistance around 27-28.
Intel (Weekly):
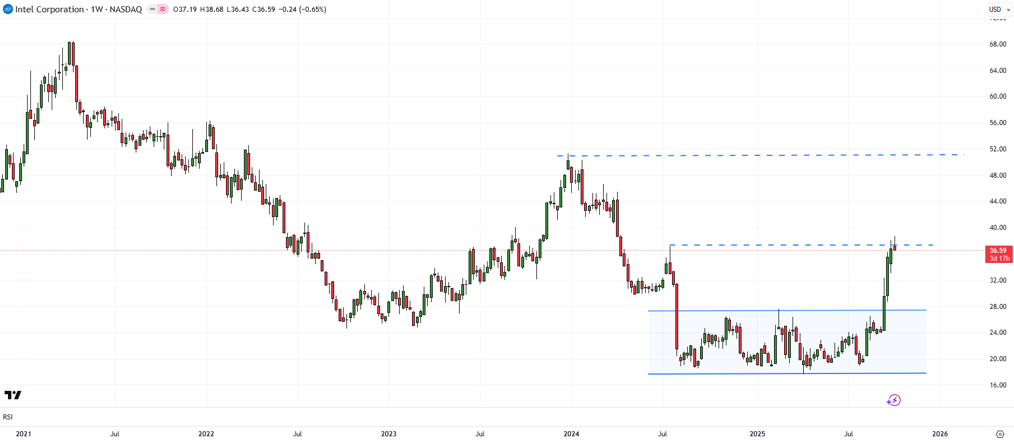
On technical charts, after a multi-month sideways period from mid-2024 until mid-2025, the stock has finally broken out. The upper edge of that range is a horizontal trendline from August 2024 (at about 27.75). The lower edge of the range is a horizontal trendline from November 2024 (around 18.50).
The break higher in September has triggered a bullish breakout from the pattern, opening the way toward the July 2024 high of 37.00 (as highlighted in the previous update in August). Importantly, the bullish break has laid the foundation of a change in the fortunes of the stock, possibly paving the way toward the 2024 high of 51.25.