Gold may have had a lackluster April-June quarter, but it hasn’t lost its shine completely.
After staging a spectacular rally over the past two years, gold has consolidated sideways since the beginning of the second quarter of 2025. Overbought, overcrowded conditions, the easing in trade tensions took some of the shine off the yellow metal.
However, some of the extreme overbought conditions have unwound – the 14-week Relative Strength Index (RSI) is down from above 81-82 to around 63-64 (above 70 is generally considered to be overbought). Inflows into physically-backed gold exchange traded funds have cooled off over the past couple of months from above-average investments in the first quarter of 2025, according to data from the World Gold Council.
Meanwhile, trade tensions seem to have resurfaced ahead of U.S. President Donald Trump’s August 1 tariff deadline. Media reports suggest the EU is exploring a broader set of possible counter measures against the US as prospects for an acceptable trade agreement with US fade. Mr. Trump last week repeated his threat to slap a 10% tariff on imports from members of the BRICS group of developing nations. Moreover, trade negotiations with some of the other trading partners have yet to yield meaningful results. The rise in uncertainty going into the August 1 deadline could bring back some of the safe-haven bids in gold.
Spot Gold (XAUUSD; Daily):
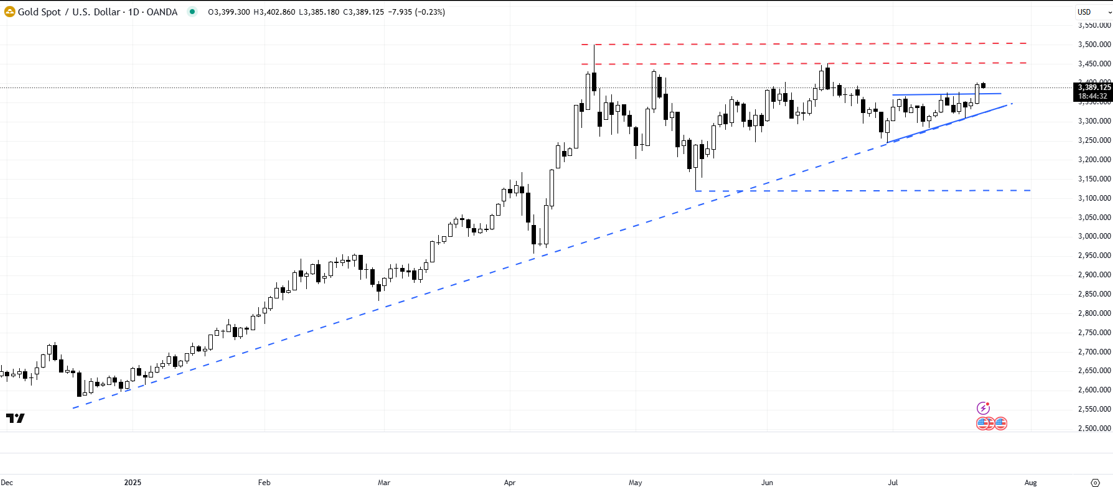
On short-term technical charts, since gold hit a record high in April, it has essentially been directionless. Nevertheless, it held above vital support on an uptrend line from the end of 2025, and the early April low of 2955.
Within the broader consolidation pattern, most recently gold has settled in an ascending triangle – the upper edge is a horizontal trendline around 3375, and the lower edge is a minor rising trendline from end June. Ascending triangles are normally bullish, that is, a breakout from the pattern is generally followed by higher prices. The price objective of the triangle works out a move toward the April high of 3500.
To be fair, choppy sideways phases can often be characterised by false breakouts. Even if the triangle breakout turns out to be a false one, the yellow metal’s strong long-term uptrend is likely to eventually reassert itself.
Spot Gold (XAUUSD; Weekly)
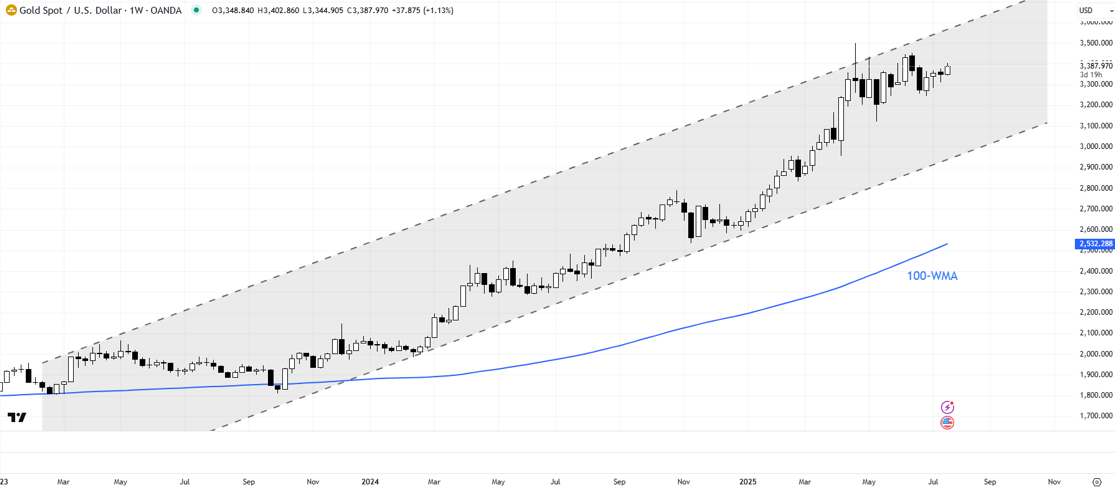
On longer-term charts, Gold has cruised in a gradually upward-sloping channel. The lower edge of the channel is an uptrend line from 2023. The upper edge of the channel is a rising trendline from 2024. Moreover, gold remains well above long-term moving averages, including the 100-week and the 200-week moving average, suggesting the broader trajectory remains up.
On the downside, a break below the end-June low of 3245 would imply an extended consolidation with a slight downward bias, potentially toward the May low of 3240.