
China equities have been essentially sideways in the past three years. Technical charts say the next move could probably be up.
Since after Covid, the iShares MSCI China ETF has underperformed global peers in recent years amid lackluster economic growth led by a slowdown in the property sector. Policy stimulus including monetary easing and infrastructure projects has helped stabilize growth in recent quarters. The Chinese economy grew 5.2% in the second quarter, exceeding market expectations despite geopolitical and trade tensions.
The International Monetary Fund on Tuesday raised its economic growth outlook for China to 4.8% this year compared with a previous forecast for 4.0%, as a result of stronger-than-expected activity in the first half and the significant reduction in US-China tariffs.
US-China tariff talks in Sweden ended on Tuesday without a trade deal. US and China had preliminary deals in May and June with an August 12 deadline to reach a trade agreement. However, a possibility of tariff truce extension remains given that the two-day meeting between the two parties in Sweden was productive. An extension / a concrete trade agreement between US-China could push China equities higher from the three-year sideway range.
From a valuation perspective, despite the recent rise, China equities remain cheap relative to its own history and relative to some of its peers, especially the US equity market.
iShares MSCI China ETF (MCHI; Weekly):
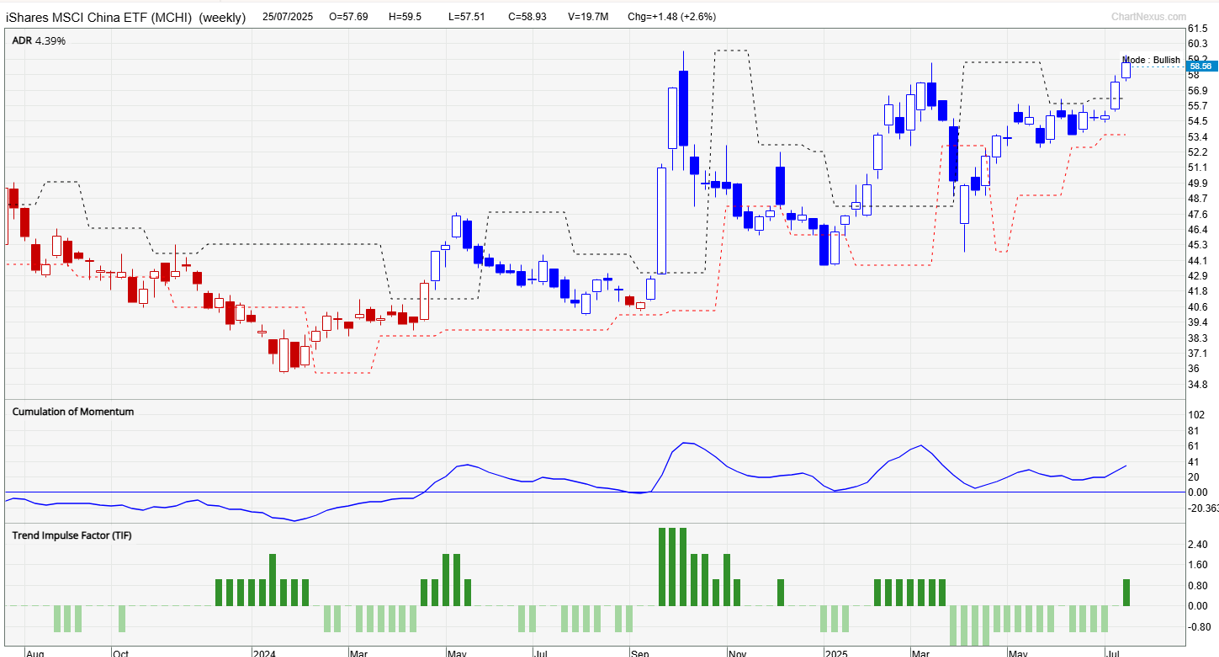
Our proprietary system TradersGPS (TGPS) shows the security is in Bullish trend. Since late 2024, the candle colour has been Blue – as per our system, Blue candles indicate the security’s trend is up, while Red candles indicate the security’s trend is down. Despite the broader volatility in financial markets in April as a result of tariff concerns, the colour of the candles didn’t change.
iShares MSCI China ETF (MCHI; Weekly):
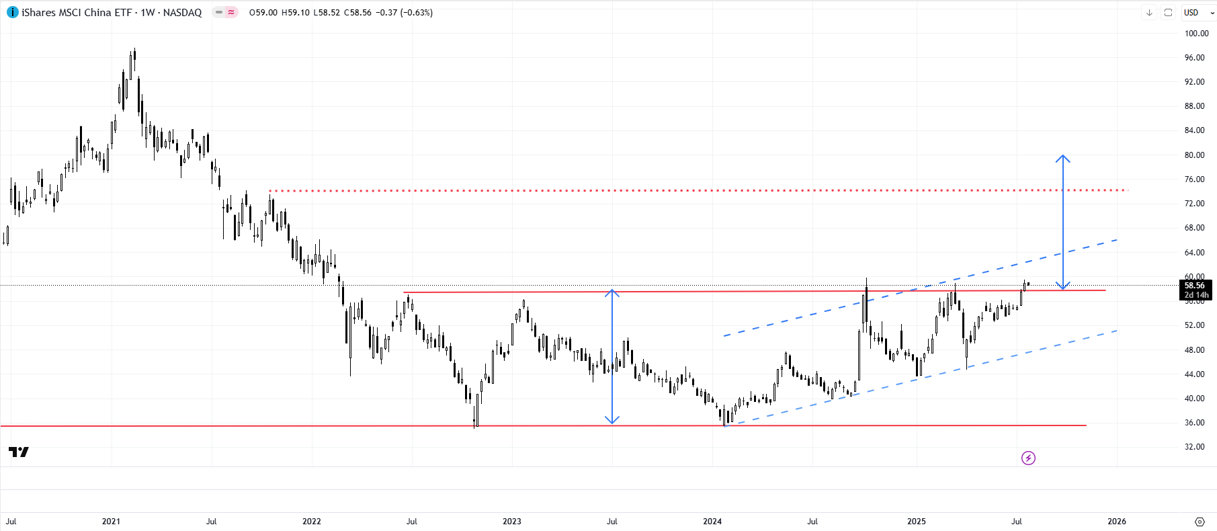
On technical charts, the trend has been sideways since 2022, with a strong base established around 36. Most recently, the security has repeatedly tried to break above the upper edge of the range (at about 58). A decisive break could trigger a breakout from the channel opening the way toward 80 (the price objective of the sideway channel).
Interim resistance is around 65 (the 50% retracement of the 2021-2022 fall), followed by the September-October 2021 high of 73.50. On the downside, there is vital support on the lower edge of a minor rising channel from 2024 (now at about 48).
The risk is that US-China trade talks don’t lead to a concrete trade agreement, raising the risk of a renewed bout of volatility. Failed attempts to surpass resistance at 58 could push the index back into its well-established sideways range.