Trading Education
How Multi-Timeframe Moving Averages Work
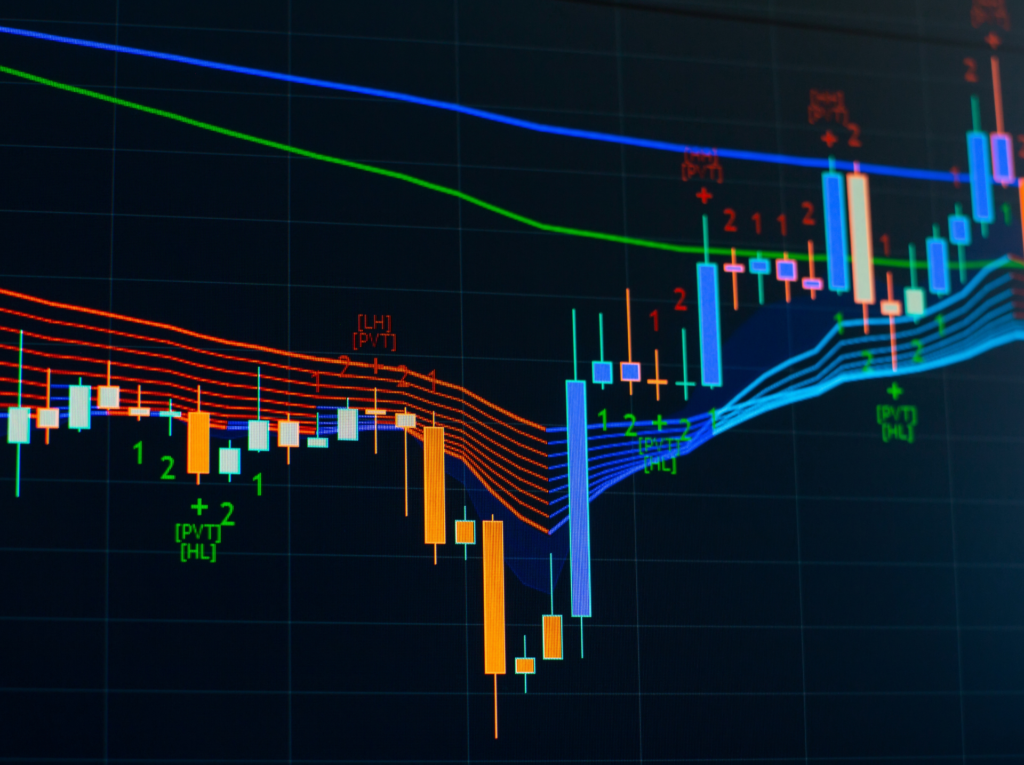
Multi-timeframe moving averages (MTF MAs) combine data from different chart timeframes (e.g., daily, weekly, monthly) to give you a broader view of market trends. By
Multi-timeframe moving averages (MTF MAs) combine data from different chart timeframes (e.g., daily, weekly, monthly) to give you a broader view of market trends. By
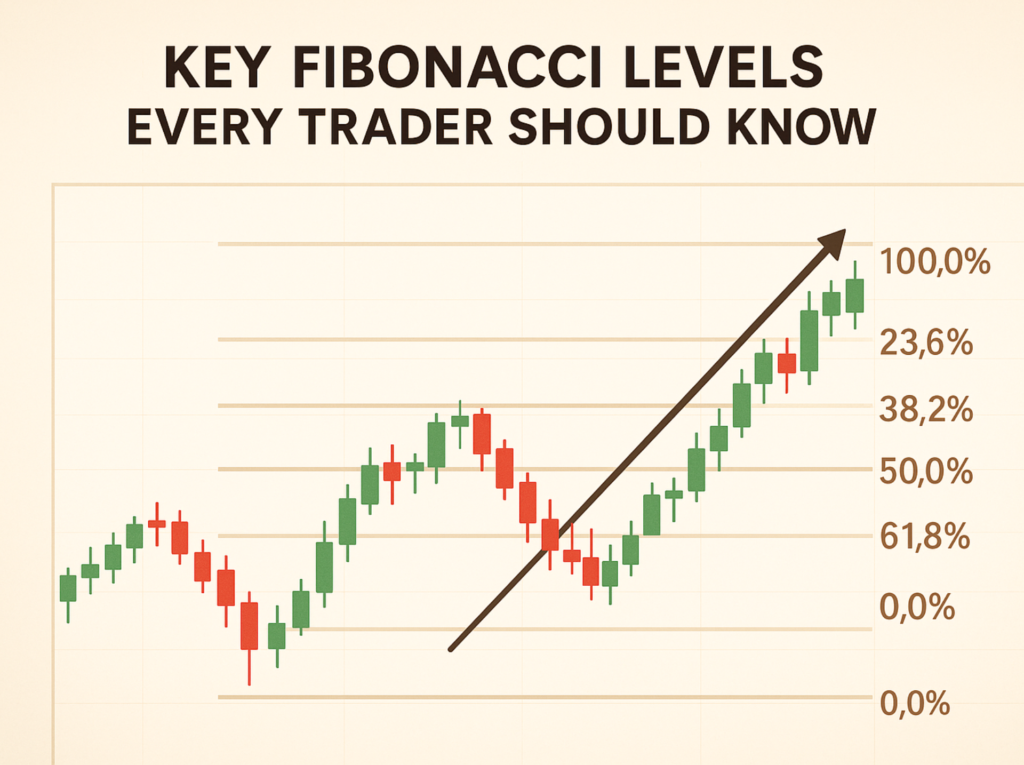
Fibonacci retracement levels are widely used in trading to identify potential support and resistance zones. These levels – 23.6%, 38.2%, 50%, 61.8%, and 78.6% –
Want to start trading stocks but feel overwhelmed by charts? Here’s what you need to know: Stock charts are visual tools that show a stock’s
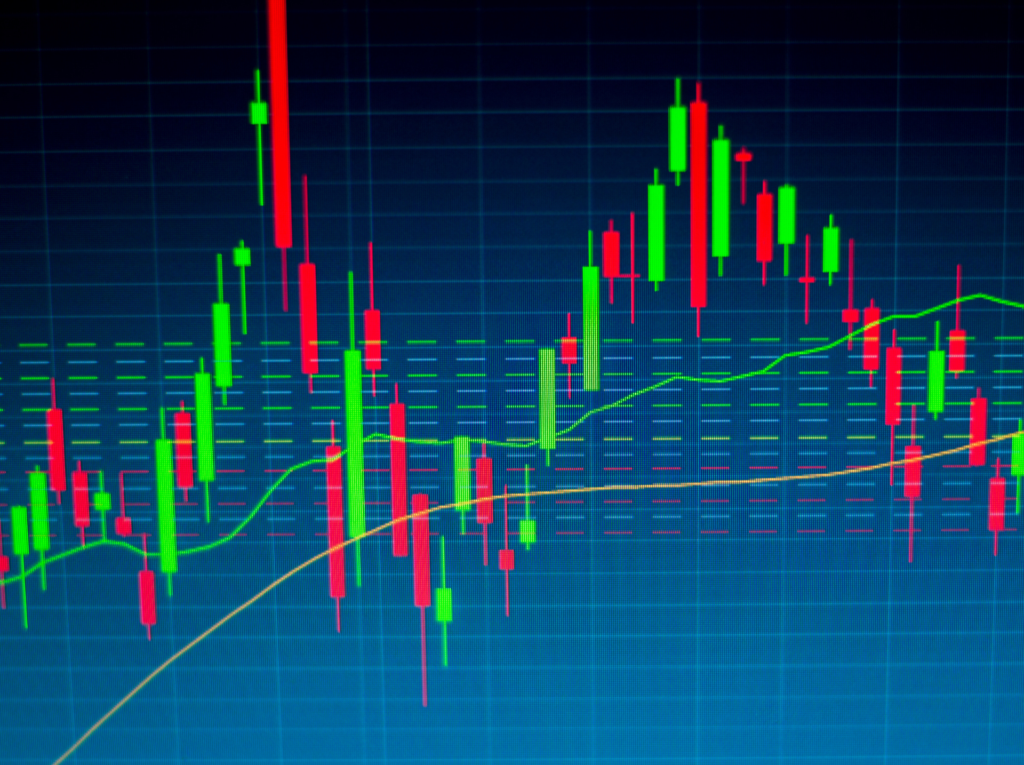
Volatility And Volume In Stock Market Entering into 2022, I wondered if the Santa Claus Rally would continue on for a couple more days… Alas,
Technical Analysis: Trend and Momentum Indicators In Stock Market November… What comes to your mind around this time of the year? For me, there are

This week Collin has prepared a special educational video for everyone. It’s called the Stochastic Pop strategy, where Collin shows his twist to using the
Do Indicators Really Work In Trading? A popular way to trade these days is via Price Action, this means trading on clean price charts. Giving