
How to Read Stock Charts: A Beginner’s Guide
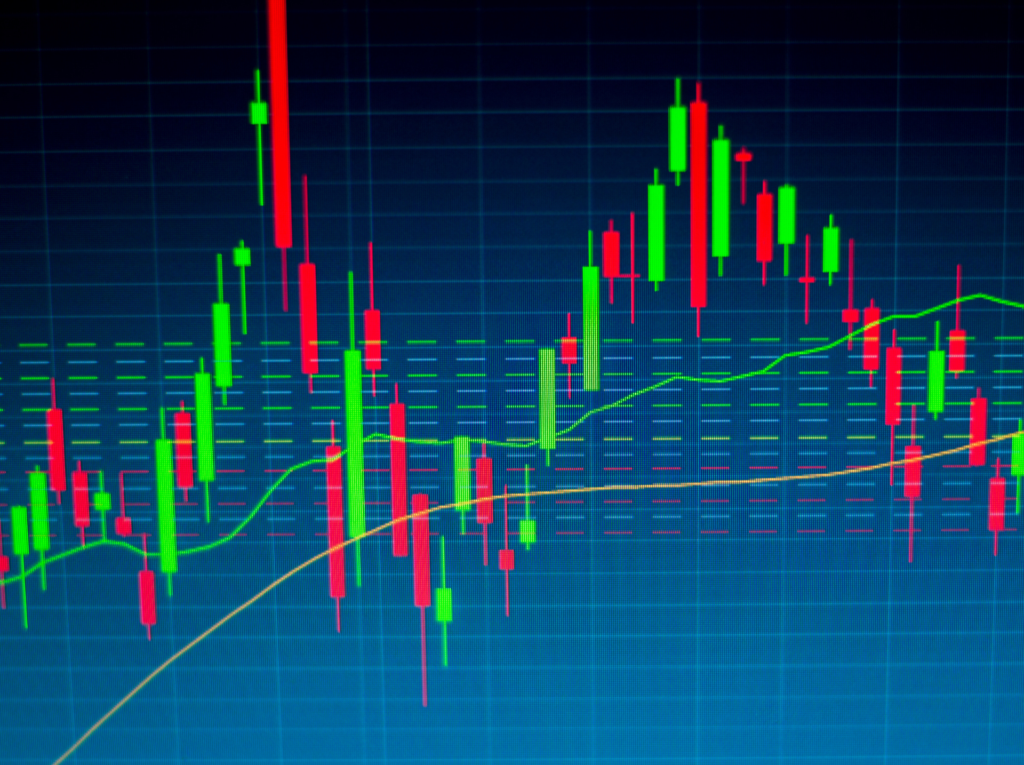
Want to start trading stocks but feel overwhelmed by charts? Here’s what you need to know: Stock charts are visual tools that show a stock’s
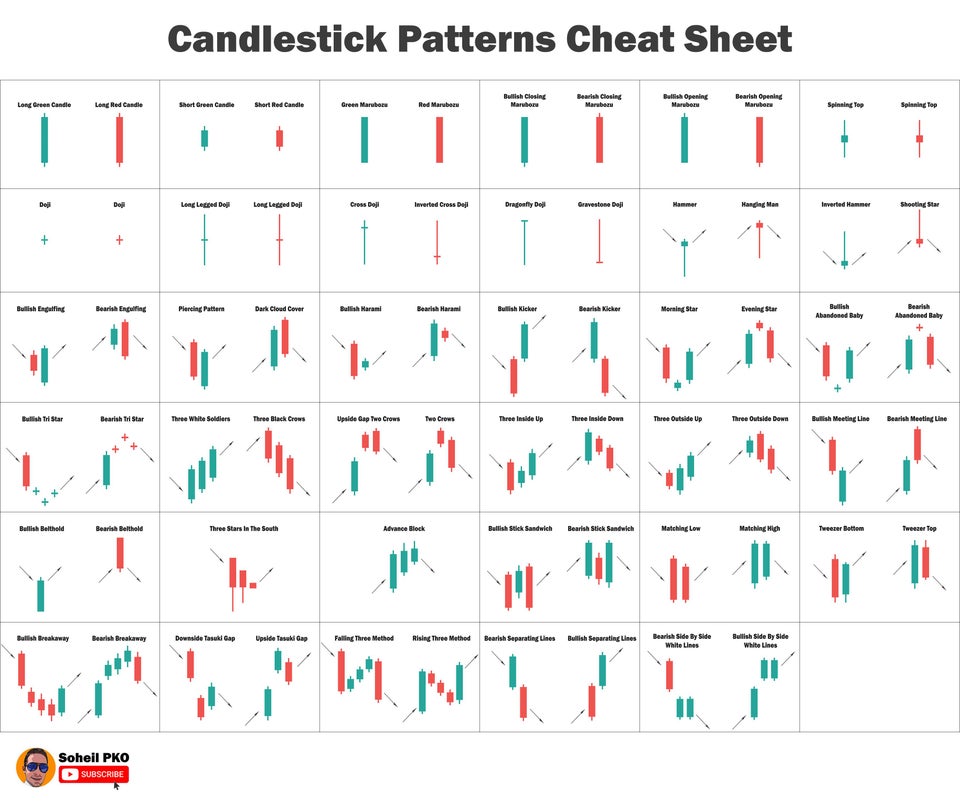
What is a Candlestick Pattern? A candlestick pattern is a charting technique used in technical analysis to help traders better predict future price movements based
This content is for informational and educational purposes only and should NOT be construed as financial advice, investment advice, or any form of recommendation regarding the suitability of any investment product, strategy, or transaction. The information provided here is general in nature and does not take into account your personal investment objectives, financial situation, or specific needs. Investing in financial products and markets involves inherent risks, including the potential loss of principal. Past performance is not indicative of future results. Before making any investment decisions, you should carefully consider your own circumstances and seek independent professional financial advice from a qualified and licensed financial advisor in Singapore. You should also conduct your own due diligence and understand the associated risks. The creator of this content is not a licensed financial advisor and is not regulated by the Monetary Authority of Singapore (MAS) to provide financial advisory services. Reliance on the information provided herein is solely at your own risk.