About the Security (NASDAQ: AAPL)
Apple Inc. is an American multinational corporation and technology company headquartered in Cupertino, California, in Silicon Valley. It designs, develops and sells consumer electronics, software and services. It is popularly known for its hardware products like the iPhone, iPad, and Mac.
Stock background:
Apple rose sharply in the week ended August 8 after CEO Tim Cook met with President Donald Trump in the White House to announce the company’s plans to spend $600 billion over four years in the US. The president announced during a public meeting that Apple would be exempt from future tariffs on imported chips.
Apple shares have underperformed its peers since April on concerns that tariffs could significantly dent the company’s profitability after President Donald Trump in May demanded that Apple make their phones in the US or face a 25% tariff. Apple seems to be already feeling the pinch from tariffs, warning that tariffs would add around $1 billion in costs in the July-September quarter after costing the company $800 million in the quarter ended 30 June.
Moreover, Apple is seemingly rebooting the company’s AI efforts. The company is reportedly planning a comeback in artificial intelligence with AI robots, home security, and smart displays.
Put together, the recent newsflow appears to be positive for Apple, explaining the bullish break in recent days. There is a possibility that Apple shares could catch up with some of its technology peers.
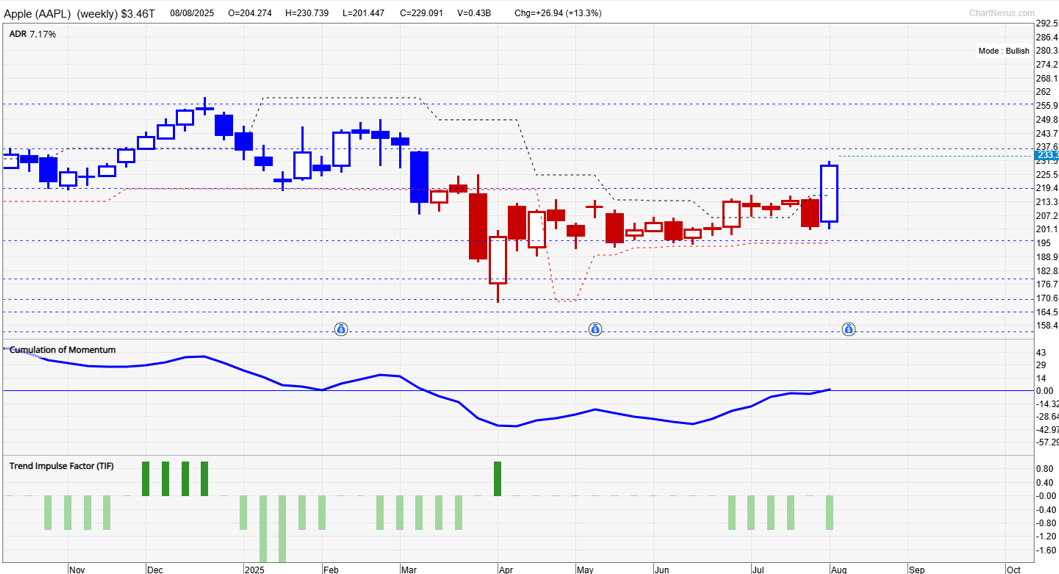
Apple (Weekly):
Technical Analysis on Apple Inc (NASDAQ: AAPL)
Our proprietary system TradersGPS (TGPS) turned Bullish last week — the first time in recent months. As per our system, Blue candles indicate the stock’s trend is up. Red candles indicate the trend is down. Back in March, the colour of the candles turned Red and remained so until the end of July. The system nicely captured the sideway/bearish trend over the past three months. However, the strong bullish move last week raises the odds that the stock could be resuming its uptrend.
Apple (Daily):
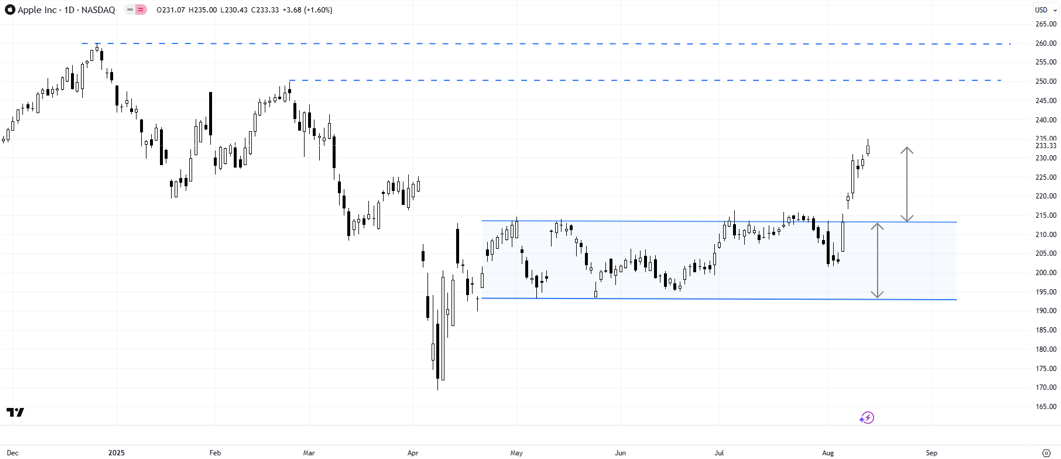
On technical charts, Apple has broken above a sideways channel since April. The lower edge of the sideway channel is a horizontal line from late April (at about 190). The upper edge of the channel is a horizontal line from April (at about 210). The implied price objective is the width of the pattern, pointing to a potential move toward 240. Most importantly, the breakout from a multi-week range suggests the stock could be gearing up toward a retest of the record high of 260 hit in December 2024.
Interim resistance is at the February high of 250, followed by the December high of 260. Immediate support is on the upper edge of the channel at 210. A break below would scale back the bullishness in the stock, putting the stock back in a broad range.