
About the Security (NYSE: BABA)
Alibaba Group Holding Limited, branded as Alibaba, is a Chinese multinational technology company engaged in e-commerce, retail, internet, and technology. The company provides consumer-to-consumer, business-to-consumer, and business-to-business sales services via Chinese and global marketplaces.
Stock background:
Alibaba shares have soared over 70% since July, marking the sharpest rebound since the downtrend began soon after COVID-19. Renewed investors’ interest in Asia ex-Japan/China equities, Alibaba’s swift progress in artificial intelligence and cloud computing, and news that the company is developing a new AI chip have triggered renewed interest in the stock.
Late September, Alibaba Group unveiled its latest full-stack AI innovations at Apsara Conference 2025, spanning from next-generation large language models, enhanced platforms for agent development, and major upgrades of its AI infrastructure. The Alibaba Group Chief Executive Eddie Wu said the company plans to spend roughly RMB 380 billion (roughly $53 billion) over three years to develop AI infrastructure.
The company reported strong fiscal Q1 earnings in August. Recent optimistic news flow has prompted analysts to upgrade their assessment of the outlook for the stock.
BABA (Weekly):
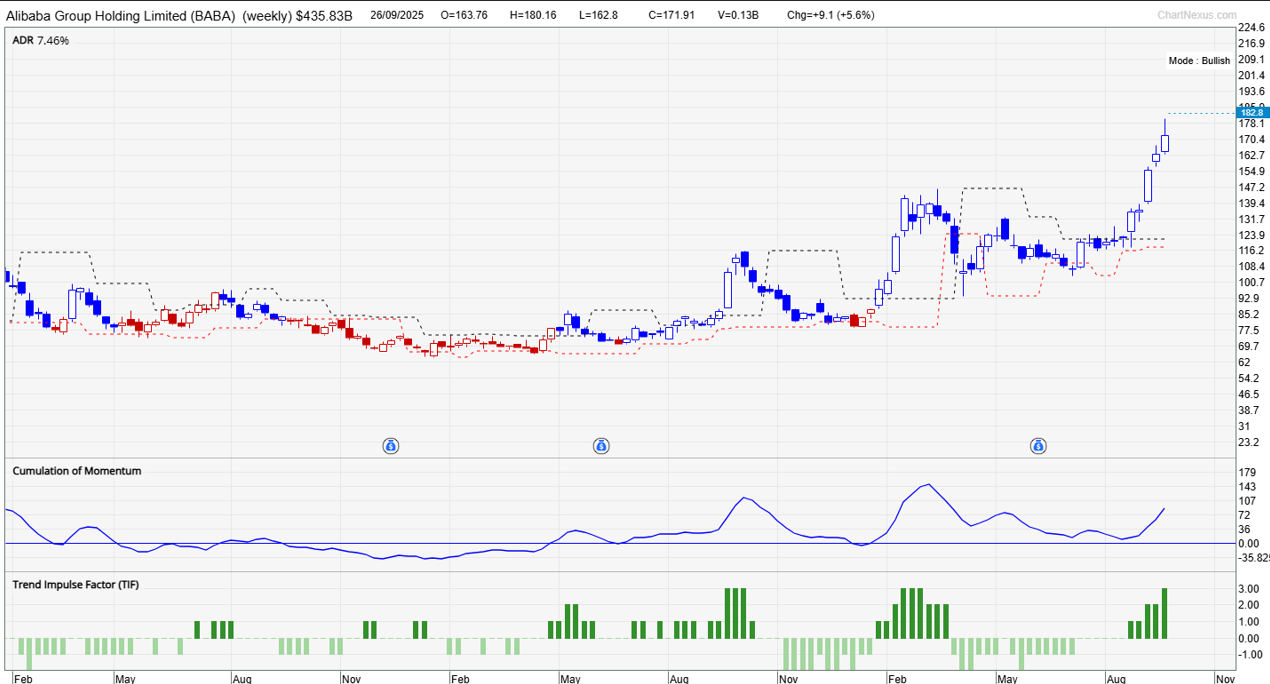
Technical Analysis on Alibaba (NYSE: BABA)
Our proprietary system TradersGPS (TGPS) has been mostly Bullish since the middle of 2024, as reflected in the Blue candles. As per our system, Blue candles indicate the stock’s trend is up. Red candles indicate the trend is down. The system is based on trend-following, which enables us to participate in a trend the moment there are signs of the emergence of a sustained trend. Sideways price action or choppy price action in a small range, that is, a directionless market, can send mixed signals.
BABA (Weekly):
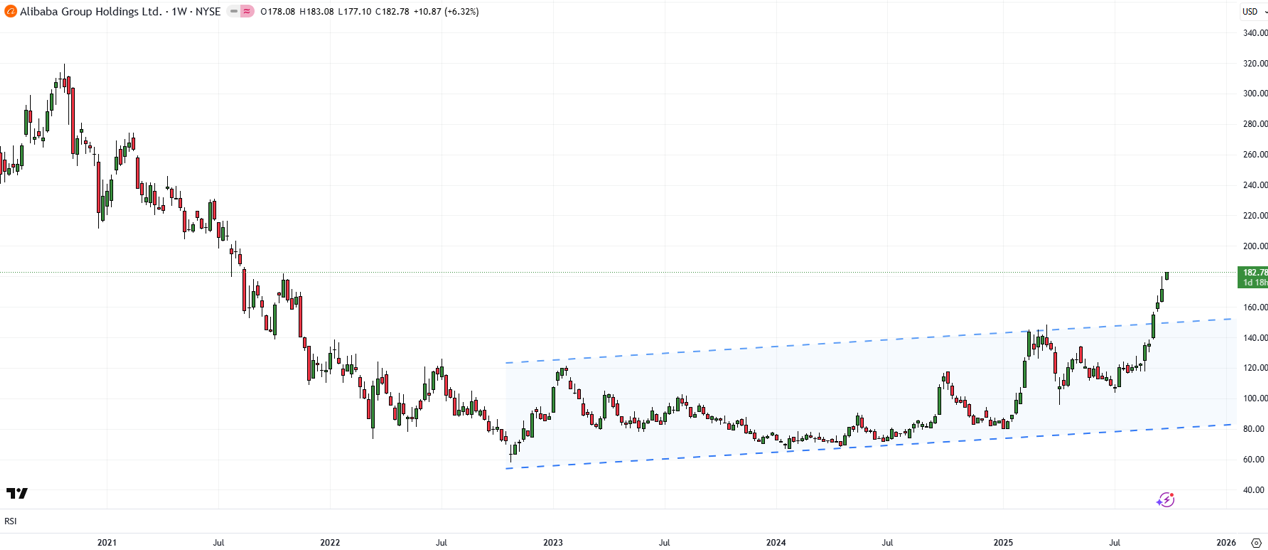
Since 2002, the stock has been confined to a narrow range – a sign of base building given the significant decline from October 2020. Subsequently, it appeared to have consolidated in a slightly upward sloping channel – the lower edge of the channel is a rising trendline from 2022, while the upper edge of the channel is a rising trendline from early 2023.
The most recent rise above the upper edge of the channel has triggered a breakout from the multi-month sideways range, pointing to a potential rise toward 220 based on the width of the pattern. Importantly, the breakout has put the stock back on its upward trajectory.
Immediate resistance is at the October 2021 high of 182, followed by 220 (the 61.8% retracement of the 2020-2022 decline). On the downside, there is resistance-turned-support at the May high of 148. The stock will need to fall under 148 for the upside potential to fade.